↓
 
Biomass Rules

Biomass Rules

Adding Clarity to All Things Bio!

Biomass Rules
  • Home
  • About Biomass Rules
  • Contact Biomass Rules
  • Biomass Links that Rule
  • Everything BIO
  • Bio-Blog

Category Archives: science

Post navigation

← Older posts
Newer posts →

Excel Data Shaping Fundamentals Index/Match – What the Function

Biomass Rules Posted on May 30, 2025 by Mark JennerSeptember 1, 2026

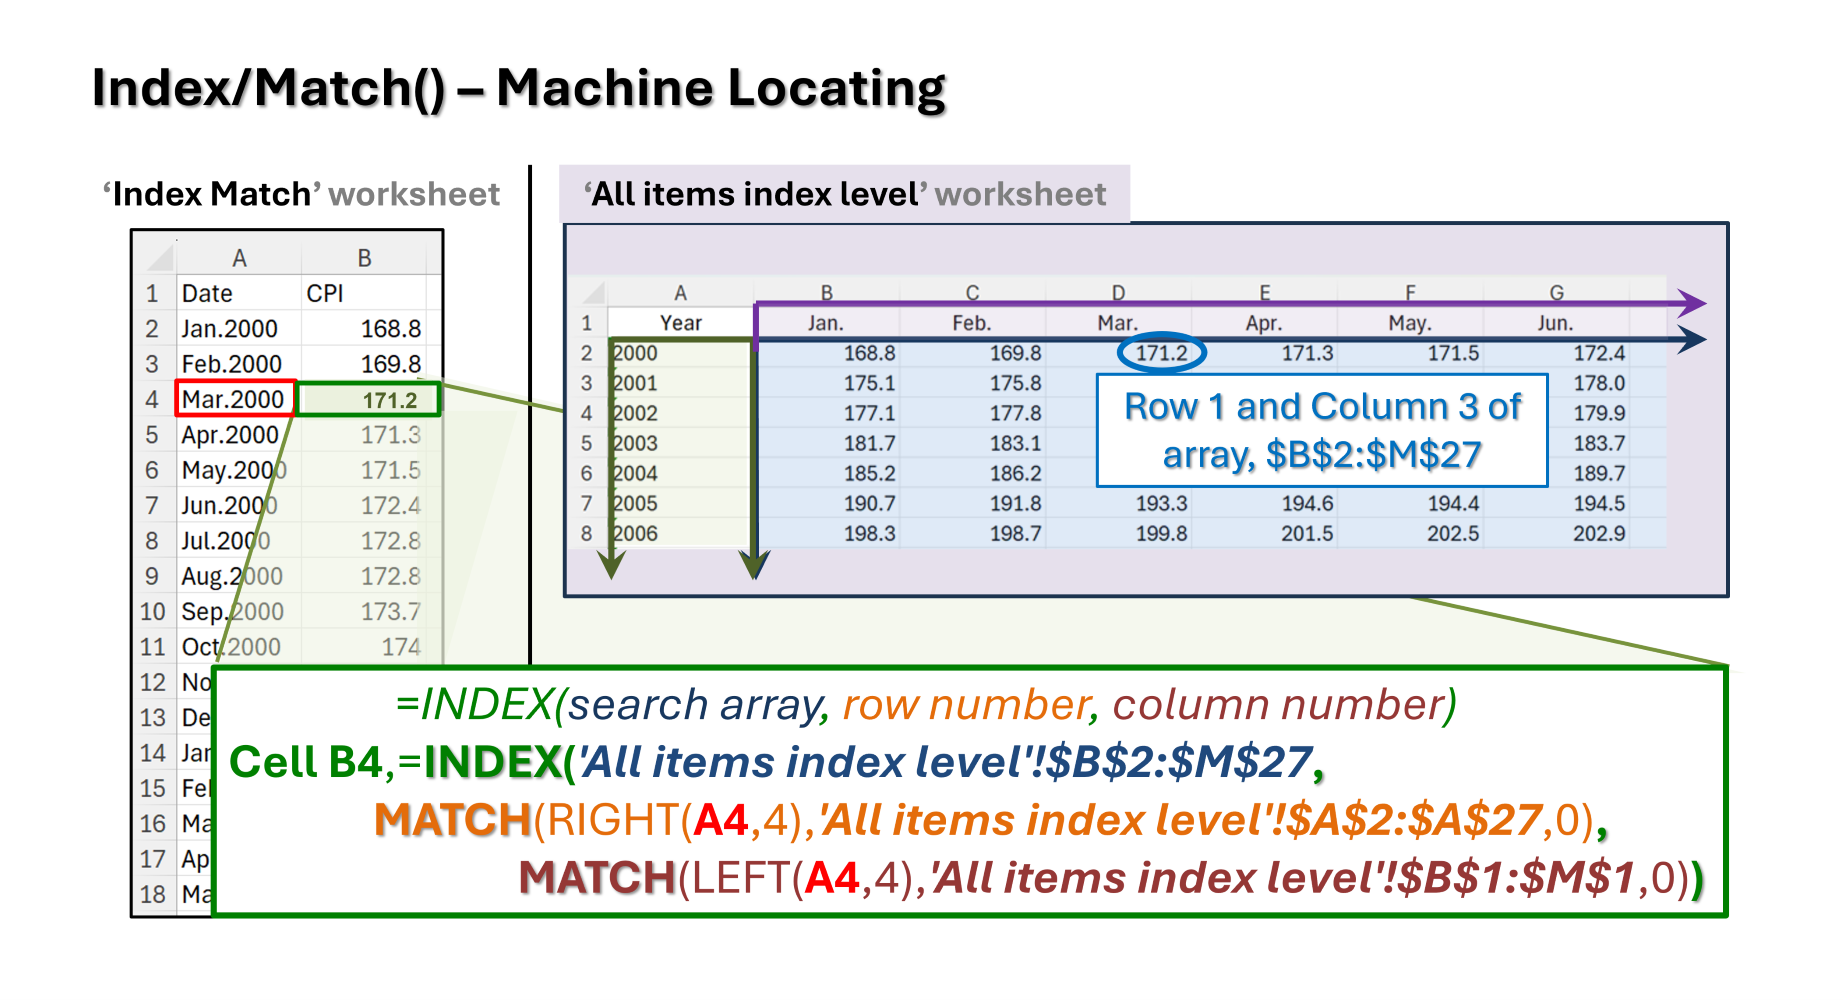
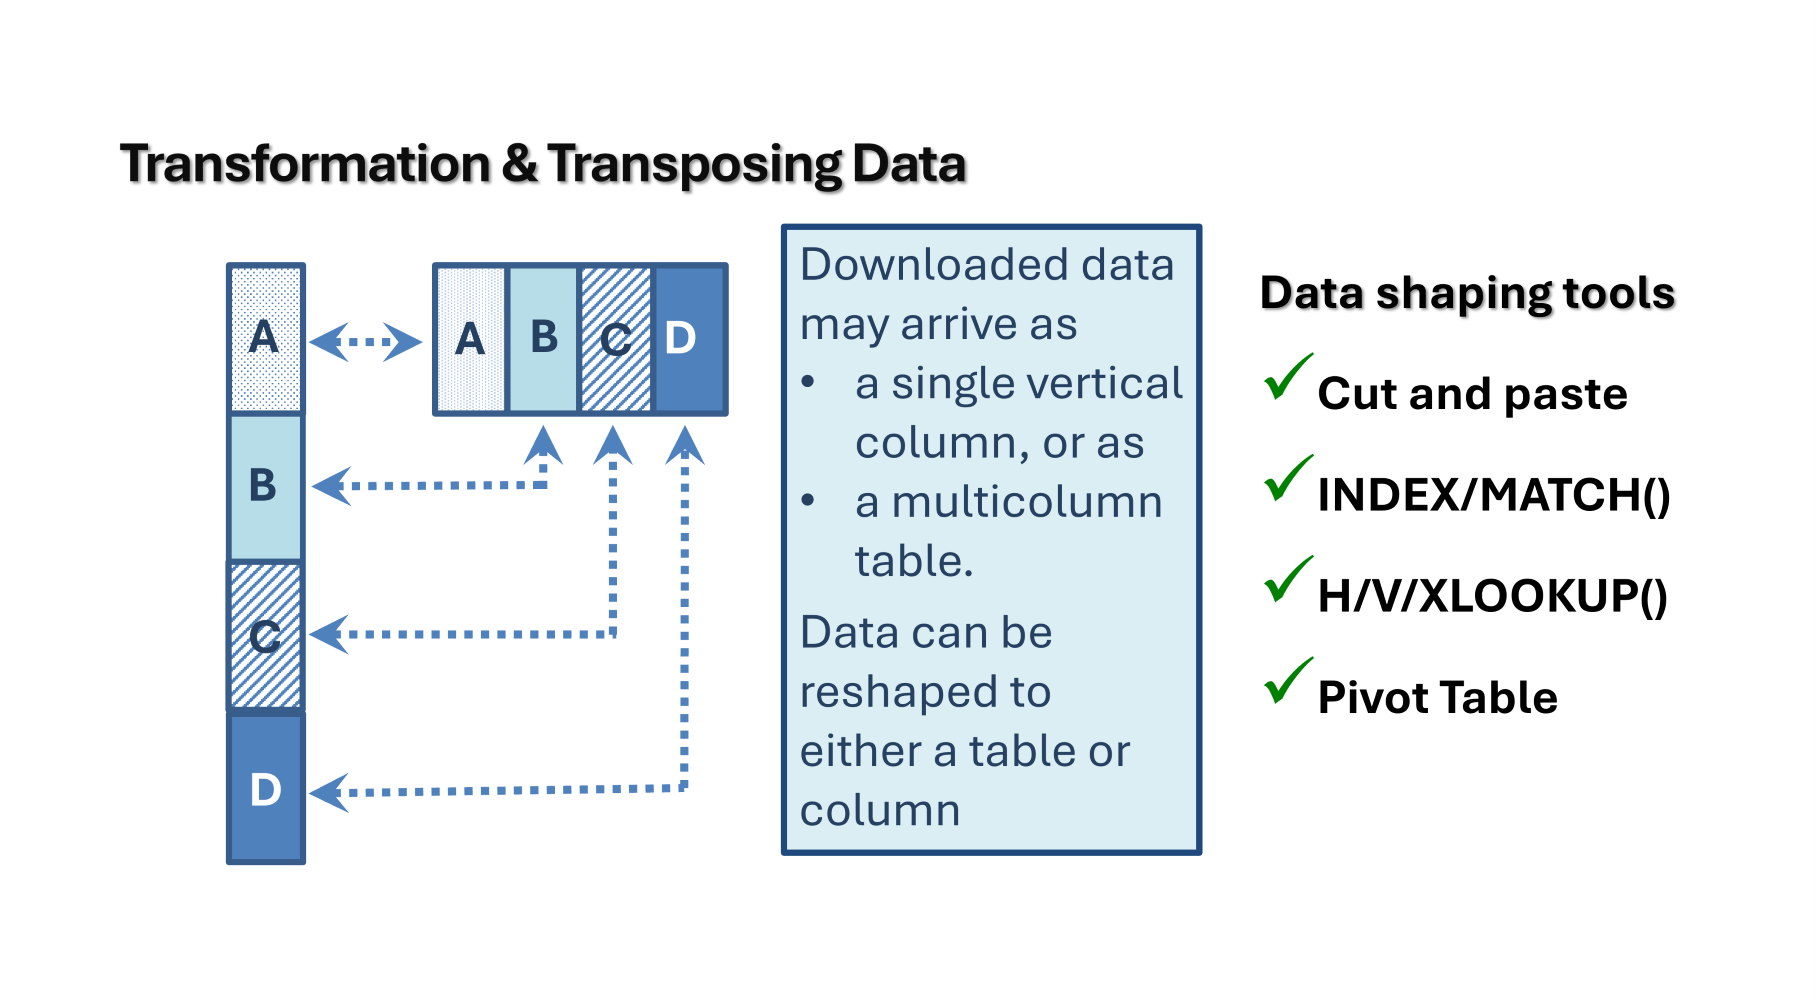
One of the most powerful Excel function tools is the INDEX/MATCH() combination.  It can be set to find specific character strings and deliver the cell contents at the intersection of the row and column string matches. This is the third … Continue reading →

Posted in analytics, economics, education, policy, science, What the Function | Tagged $ sign anchors, Bureau of Labor and Statistics (BLS), Consumer Price Index (CPI), cut and paste, date autofill, Excel data shaping fundamentals, index, INDEX/MATCH(), LEFT(), MATCH(), numeric dates, RIGHT(), shaping data, text dates, VLOOKUP(), what the function, YOUTUBE companion video | Leave a reply

Excel Data Shaping Fundamentals Cut and Paste – What the Function

Biomass Rules Posted on May 27, 2025 by Mark JennerSeptember 1, 2026

When cleaning data files in Excel, one never moves away from manually pushing data around.  Manually entering data by hand, sorting, and/or dragging and dropping in a new location; they all take time.  But for small amounts of data, a … Continue reading →

Posted in analytics, economics, education, policy, science, What the Function | Tagged Bureau of Labor and Statistics (BLS), Consumer Price Index (CPI), data validation, drag green square in highlighted range, drop and drag, Excel data shaping fundamentals cut and paste, fill dates, first 3 consecutive values, INDEX/MATCH(), insert sheet, paste special, short cuts work until they don’t, small datasets, transpose, what the function | Leave a reply

Excel Data Shaping Fundamentals File Prep – What the Function

Biomass Rules Posted on May 22, 2025 by Mark JennerSeptember 1, 2026

The last few months have provided opportunity to flex my spreadsheet skillset.  Excel code and technique seemed to erupt through the keyboard.  In the last few months, diverse datasets have included: 2024 household food expenditures 2024 household power consumption and … Continue reading →

Posted in analytics, definition, economics, macro, policy, science, What the Function | Tagged Bureau of Labor and Statistics (BLS), clean data, Consumer Price Index (CPI), CPI-U, cut and pasting, download file, empowering data skills for skeptics, Excel data shaping fundamentals, file prep, INDEX/MATCH() function, US City Average not seasonally adjusted, VLOOKUP() function, what the function | 4 Replies

Home Solar Array Offsets Two-Thirds of 2024 Power Consumption-Making $ense of Energy

Biomass Rules Posted on May 16, 2025 by Mark JennerSeptember 1, 2026

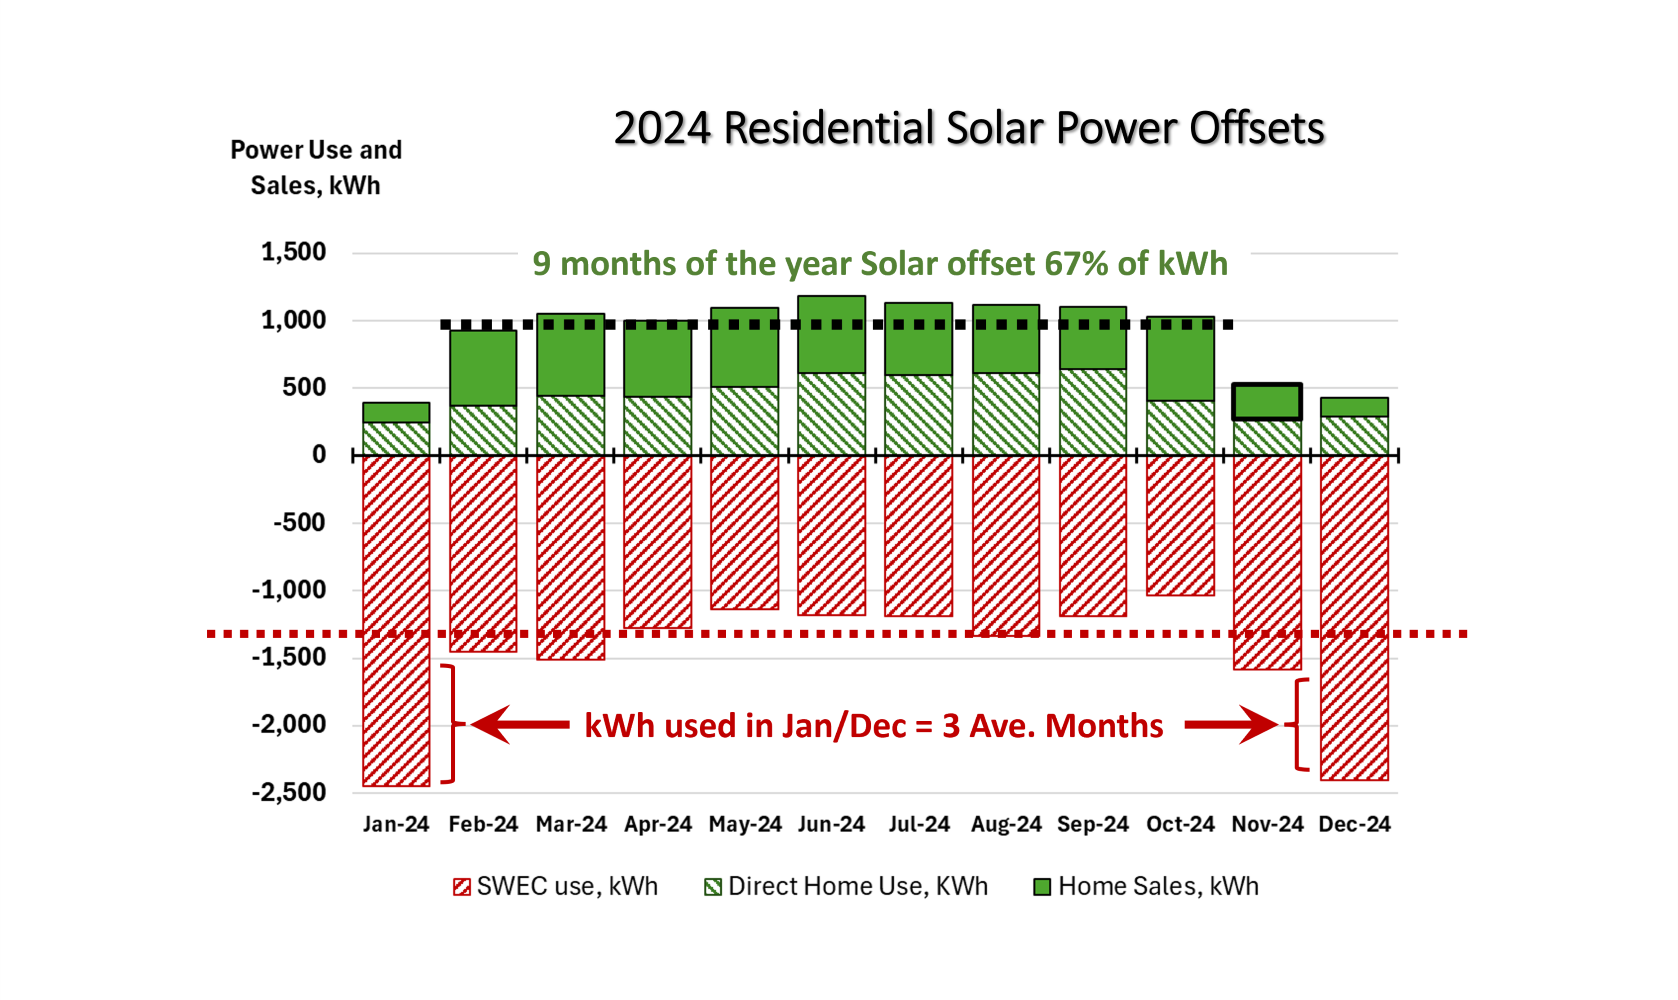
After all is said and done, this residential solar array in the non-winter months offset 67 percent of home power production.  This chart is monthly solar production and household consumption in kilowatt hours (kWh).  While it required both the solar … Continue reading →

Posted in analytics, economics, education, firm, Making $ense of Energy, policy, production, science | Tagged cloudy days, consumption, direct offset, early morning and late evening limited light, home solar array offset two-thirds of 2024 power consumption, incremental additions, kilowatt-hours (kWh), Making $ense of Energy, making sense of energy, production, small wind and hydro, solar power, solar sales, solar sales one third of power price, utility power consumption | Leave a reply

Lessons Learned from 18,000 Points of Light – Making $ense of Energy

Biomass Rules Posted on May 13, 2025 by Mark JennerSeptember 1, 2026

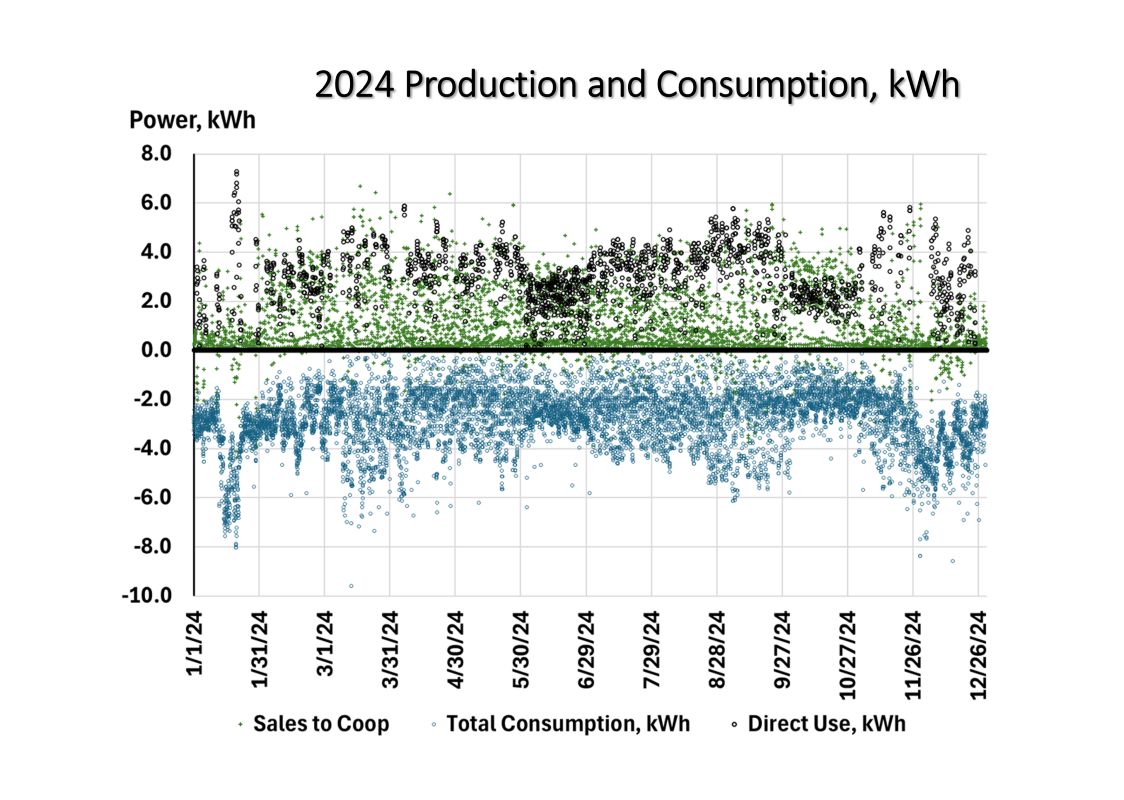
The joy of finding a new dataset to explore enflamed my modeling focus more than was justified.  IT WAS GREAT TO BE LOOKING FOR STORIES IN A BRAND NEW DATASET! Challenge #1:  Monthly data from the power utility was too … Continue reading →

Posted in analytics, economics, education, Making $ense of Energy, policy, production, Renewable Fuel, science, wealth creation | Tagged 2024, annual, daily, direct use, forensic modeling of missing data, hourly, kilowatt-hours (kWh), kilowatts (kW), lessons learned from 18000 points of light, Making $ense of Energy, making sense of energy, minutes, monthly, residential solar power, solar panel power production, solar panel power sales, south Central Illinois, utility supplied power | Leave a reply

Selecting Meaningful Labels for 130,000 Data Points – What the Function

Biomass Rules Posted on May 7, 2025 by Mark JennerSeptember 1, 2026

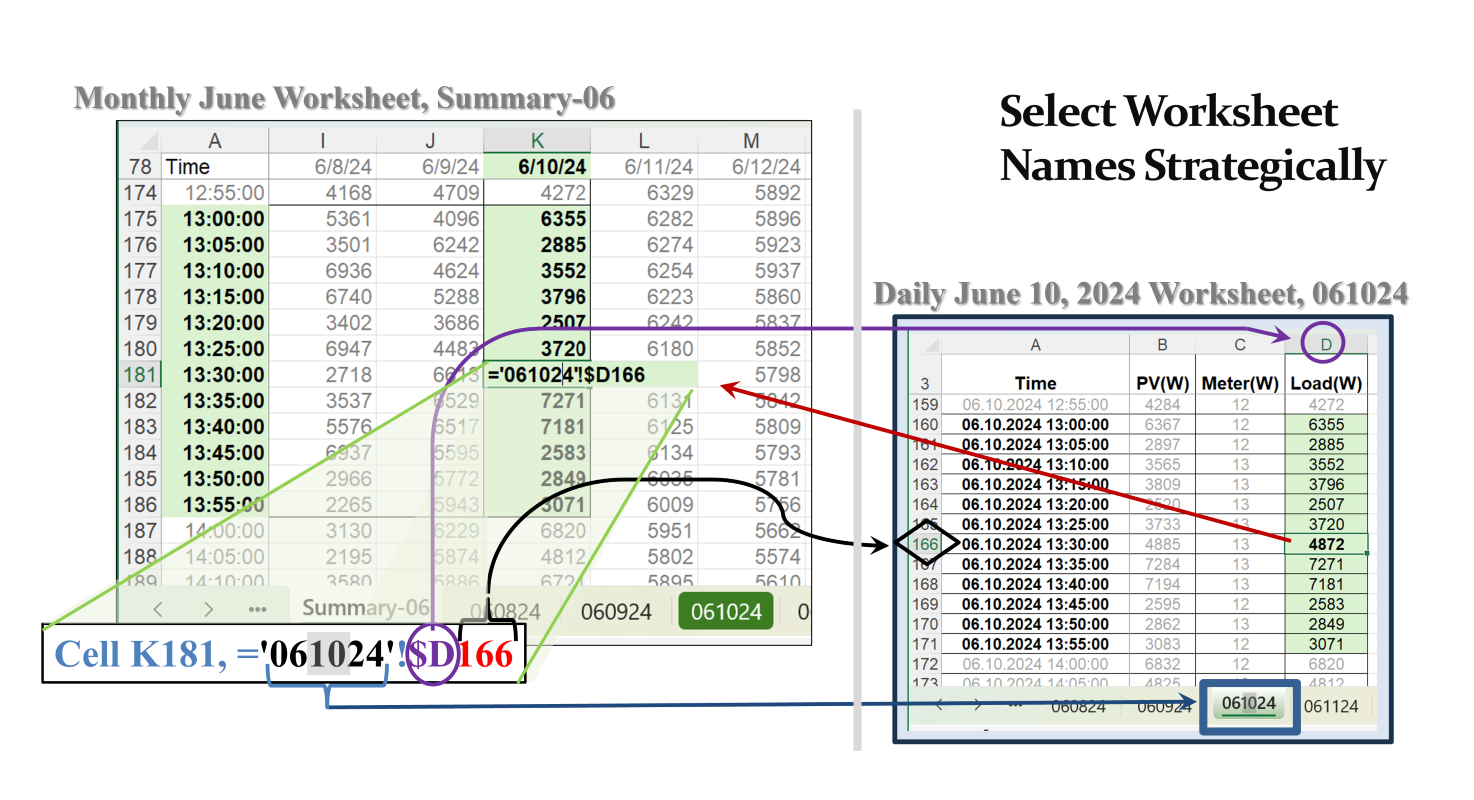
A year contains half a million minutes.  The residential solar panel data arrived in five-minute increments, or about 20 percent of the annual minute universe.  Adding in the utility generated data, the two data sources delivered about 130,000 data points. … Continue reading →

Posted in analytics, definition, economics, firm, policy, production, science, What the Function | Tagged $ sign anchor, annual data, cell address, columns, day, files, five-minute intervals, hour, kilowatt-hour (kWh), kilowatts (kW), month, rows, selecting meaningful labels for 130000 data points, sheet address, sheets, solar panel data, watts, what the function, year | Leave a reply

Sheets Happen, …But Not Automatically – What the Function

Biomass Rules Posted on May 5, 2025 by Mark JennerSeptember 1, 2026

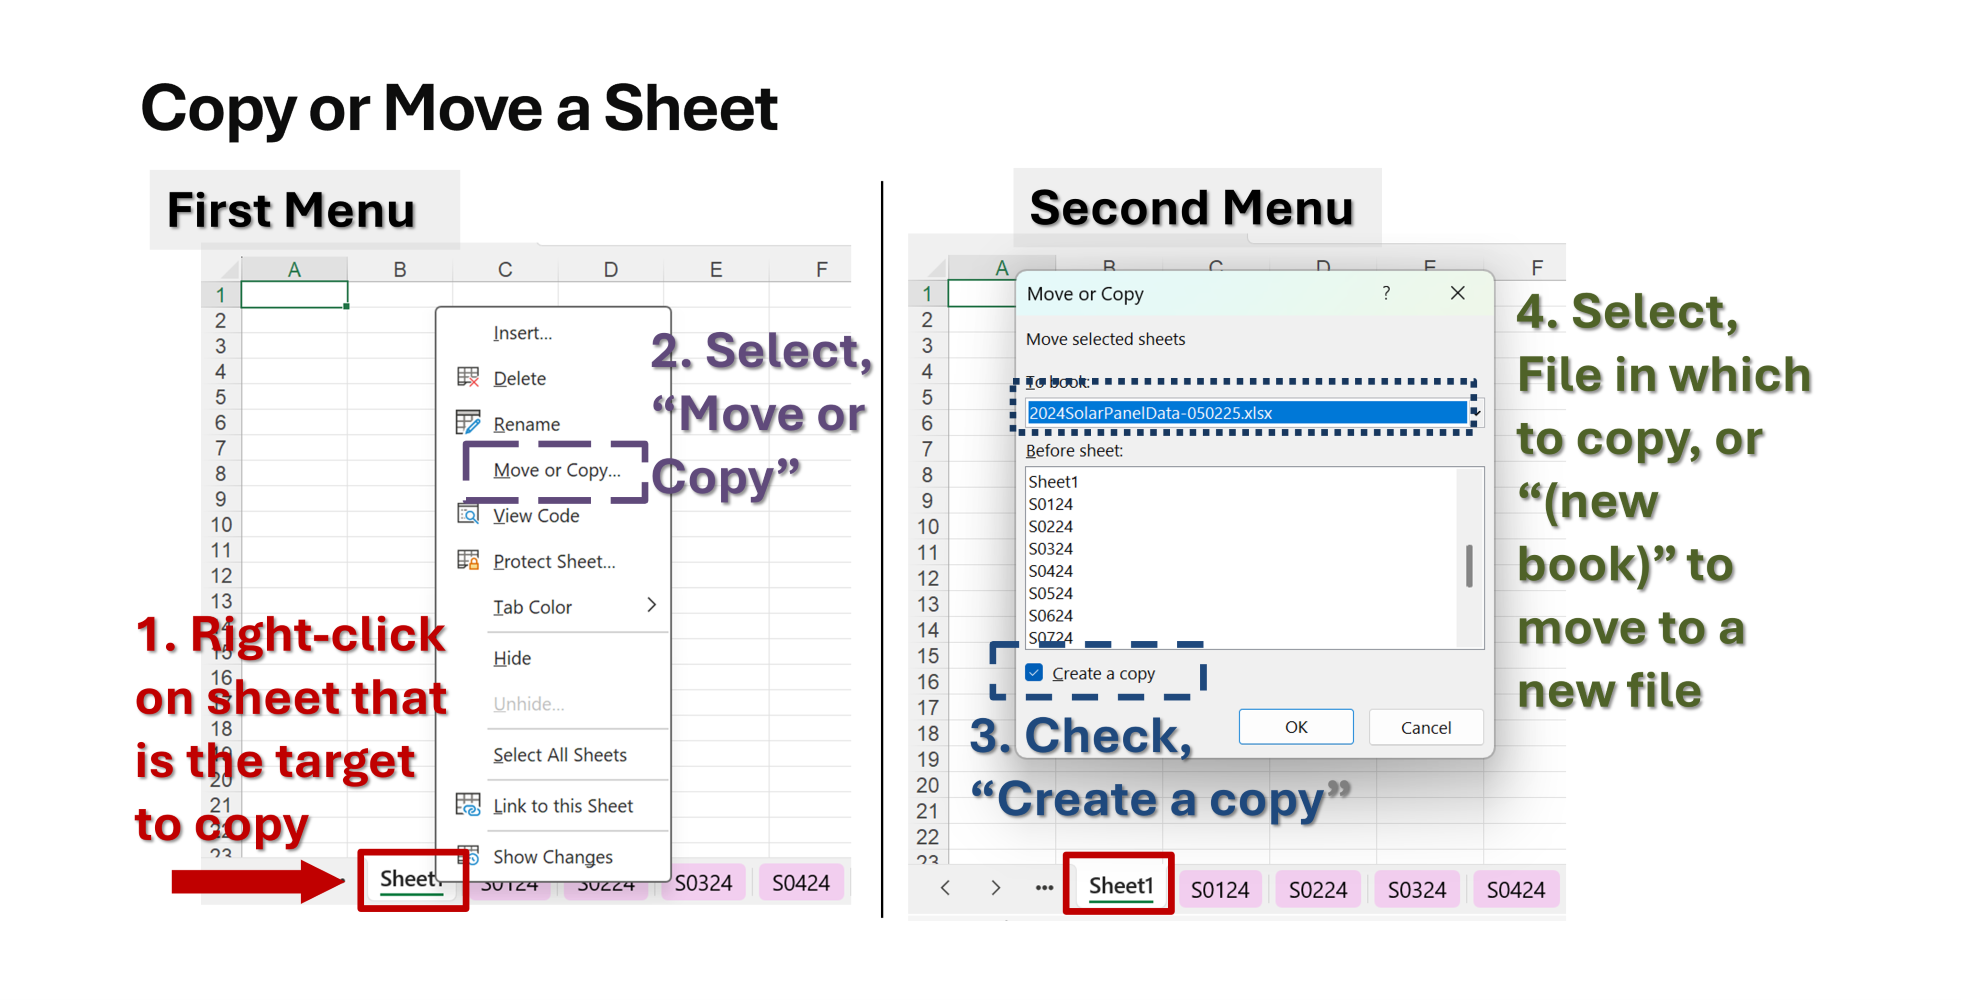
Excel sheets happen, but only if one knows the hidden menus upon which to click. One of the most useful Excel tricks is copying spreadsheets.  Copying and moving a sheet doesn’t show up a lot in the spreadsheet tricks that … Continue reading →

Posted in analytics, definition, education, policy, science, What the Function | Tagged backups, But Not Automatically, copying sheets, Create a copy checkbox, Excel sheets, good spreadsheet habits, Move or Copy menu, moving sheets, objects, redundancies, Sheet tab menu, Sheets Happen, To book dropdown menu., what the function, worksheets | 2 Replies

Forensic Modeling to Bridge Dataset Gaps – Making $ense of Energy

Biomass Rules Posted on May 1, 2025 by Mark JennerSeptember 1, 2026

Modeling tools are used for more than forecasting.  To complete the analysis of household energy consumption, forensic data modeling was required.  Data from two different datasets were needed, and was in slightly different formats that prohibited a smooth alignment. The … Continue reading →

Posted in analytics, definition, economics, firm, Making $ense of Energy, policy, production, science | Tagged data is powerful, daylight hours, forensic modeling to bridge dataset gaps, household power correlated to ambient temperature, important to wallow in the data, kW, kWh, Making $ense of Energy, making sense of energy, math is cheaper than technology (primary data collection), multi-source data can be combined, non-daylight hours, solar panel power, solar sales to utility, utility-provided power, weighted factors | Leave a reply

Mapping 10,000 Points of Hourly Power Use – Making $ense of Energy

Biomass Rules Posted on April 29, 2025 by Mark JennerSeptember 1, 2026

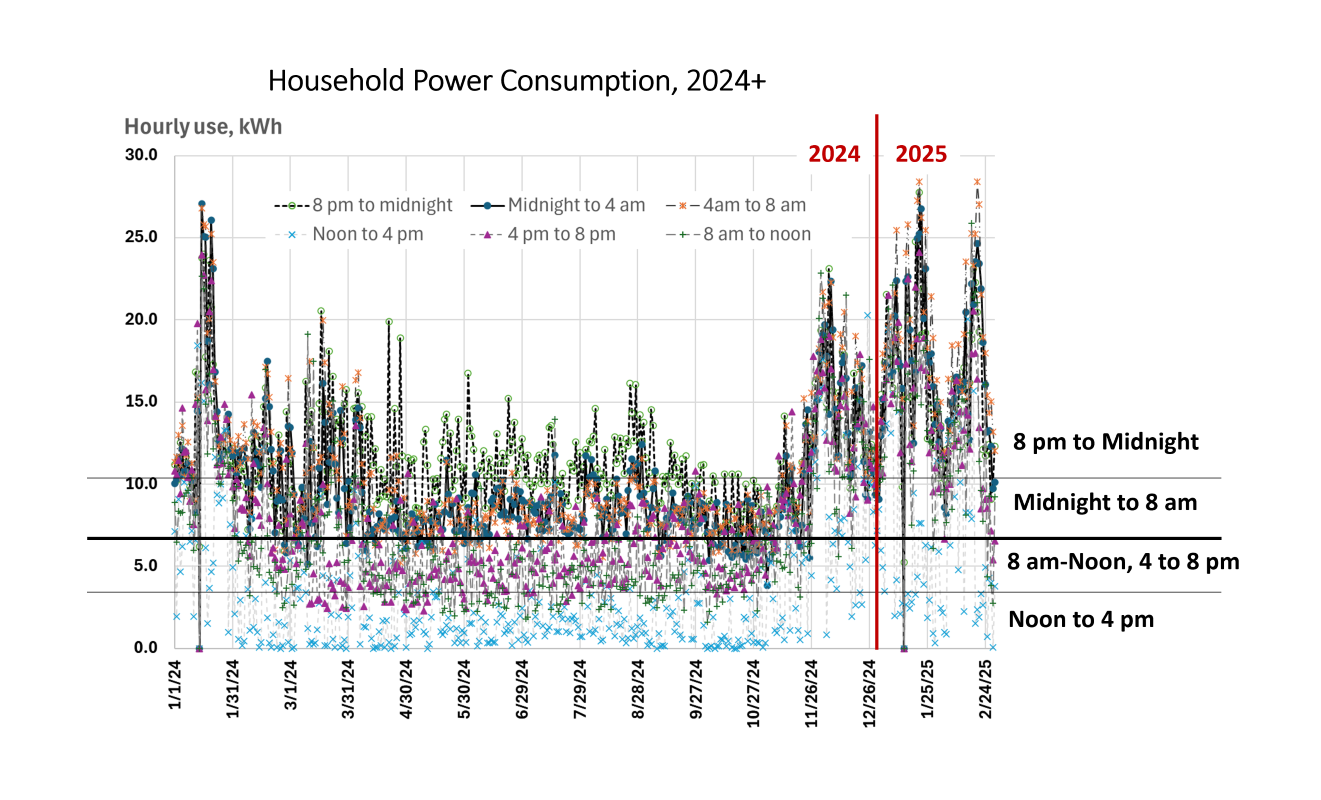
In February, I asked my Electric Cooperative for help in understanding our solar panel output for 2024.   They responded with 10,000 data hourly power consumption points over the 12 months of 2024 and the first two months of 2025. As … Continue reading →

Posted in analytics, economics, firm, Making $ense of Energy, policy, production, Renewable Fuel, science | Tagged 5-minute increment, daily, daylight, demand, electric cooperative, historical data, hourly, hypothetical data, kilowatt (kW), Making $ense of Energy, making sense of energy, mapping 10000 points of hourly power use, modeling total household demand, monthly, nighttime, off-peak, sales, solar offsets, solar production, supply | 1 Reply

Comparative Monthly Solar Output – Making $ense of Energy

Biomass Rules Posted on April 21, 2025 by Mark JennerSeptember 1, 2026

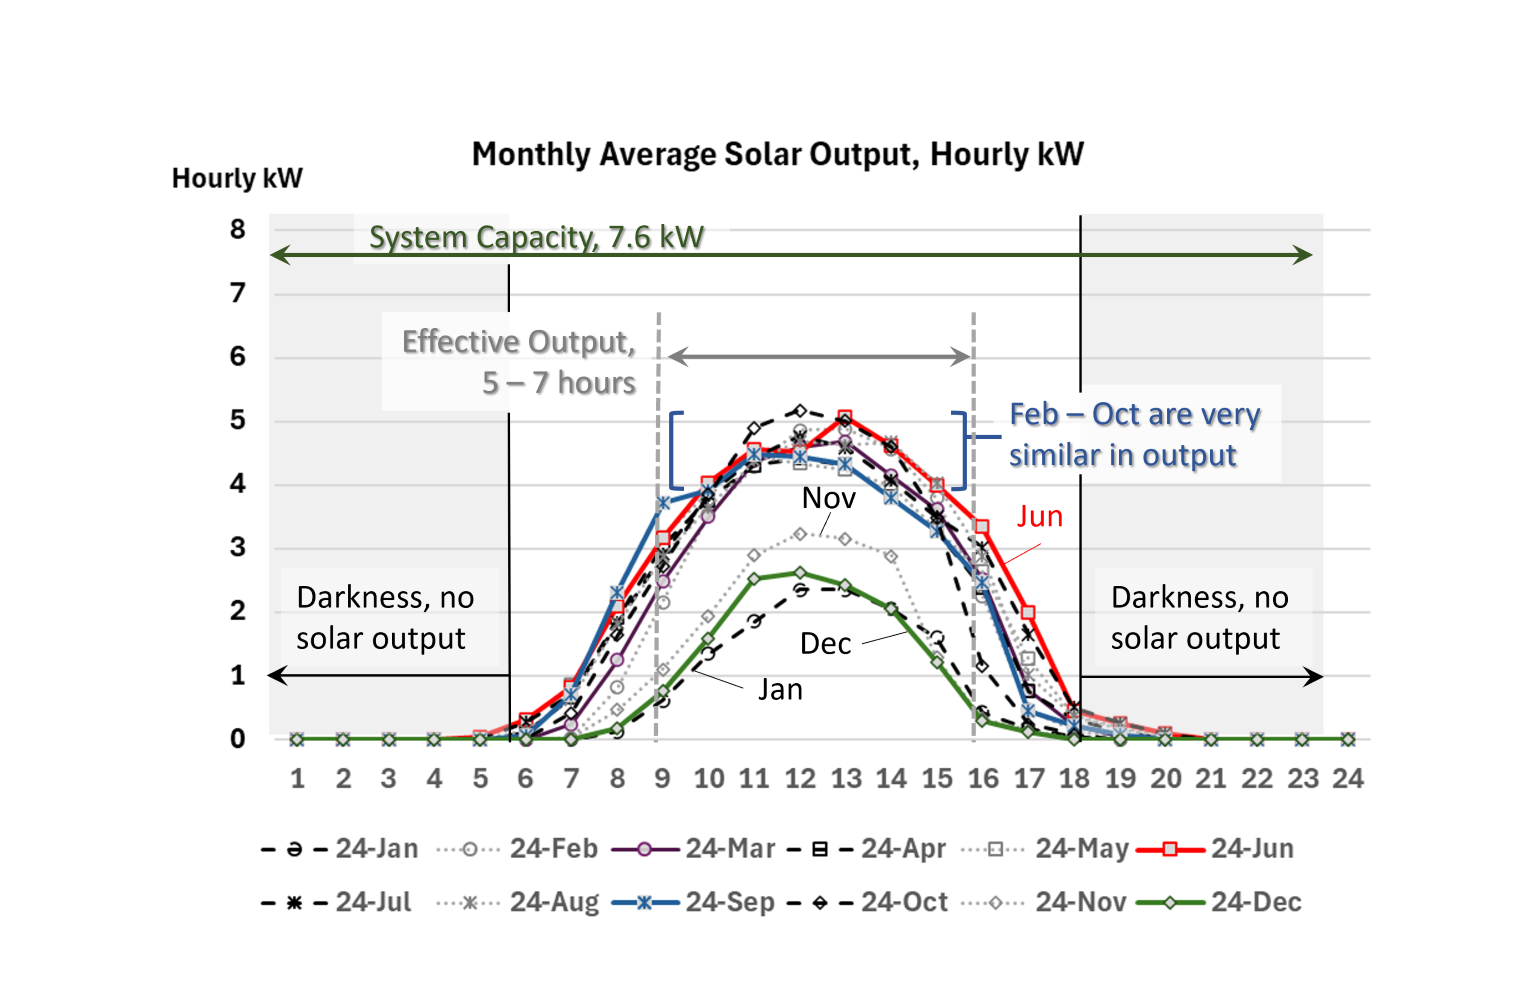
This post continues the deeper dive into power production of a residential solar array.  The last post on solar output looked at daily variability of this solar array in June 2024.  Variability from cloud cover in this geographic location, 45 … Continue reading →

Posted in economics, farm, firm, Making $ense of Energy, policy, production, science | Tagged 12 hours of darkness, 12 months, 2024, 24-hours, 25 percent of daily hours, 70 percent of capacity, cloud cover, comparative monthly solar output, counter-intuitive, daily variability, effective peak production, intuitive, kilowatts, less intuitive, Making $ense of Energy, making sense of energy, monthly variability | 1 Reply

Post navigation

← Older posts
Newer posts →

Recent Posts

  • US Dairy Farms Keep Lowering Methane Emissions
  • Reflecting on the Start of a College Teaching Career, August 2016
  • Junior Livestock Sales – Unbridled Community Joy Over Rural Youth
  • Remember, US Farms Continually Produce more Outputs using Fewer Inputs!
  • 24 Months of Power Production on A Residential Solar Array – Making $ense of Energy

Mark Jenner, PhD
Biomass Rules
Greenville, IL 62246
c. 618.223.9331
e. biomassrules@gmail.com

Linked In Logo for Mark Jenner's Profile including Biomass Rules.com!

Mission Statement:
Providing solutions through the strategic utilization of all kinds of biomass; the development of new markets for food, fiber, and fuels; and streamlining regulations.

bio·mass:
ˈbī-ō-ˌmas. noun. 1 : the unit area or volume of living matter, 2 : plant materials and animal waste used as renewable feedstocks into new processes.

rules:
'rül. 1: noun. 1 : regulations, bylaws or governing procedure, 2: verb. a : to exert control, direction, or influence on, b : to declare authoritatively.

Manure…
is not a four-letter word.

©2024 to Present—Biomass Rules—All Rights Reserved.

↑