

Excel Data Shaping Fundamentals File Prep – What the Function
The last few months have provided opportunity to flex my spreadsheet skillset. Excel code and technique seemed to erupt through the keyboard. In the last few months, diverse datasets have included:
- 2024 household food expenditures
- 2024 household power consumption and solar energy production
- Since the solar panel data, I downloaded and cleaned 150 days of fitbit data (9,000 data points per day).
This, ‘What the Function’ series is intended to share applied Excel tricks and tips. Everyone should know how to get public data and fact check it when they are skeptical.
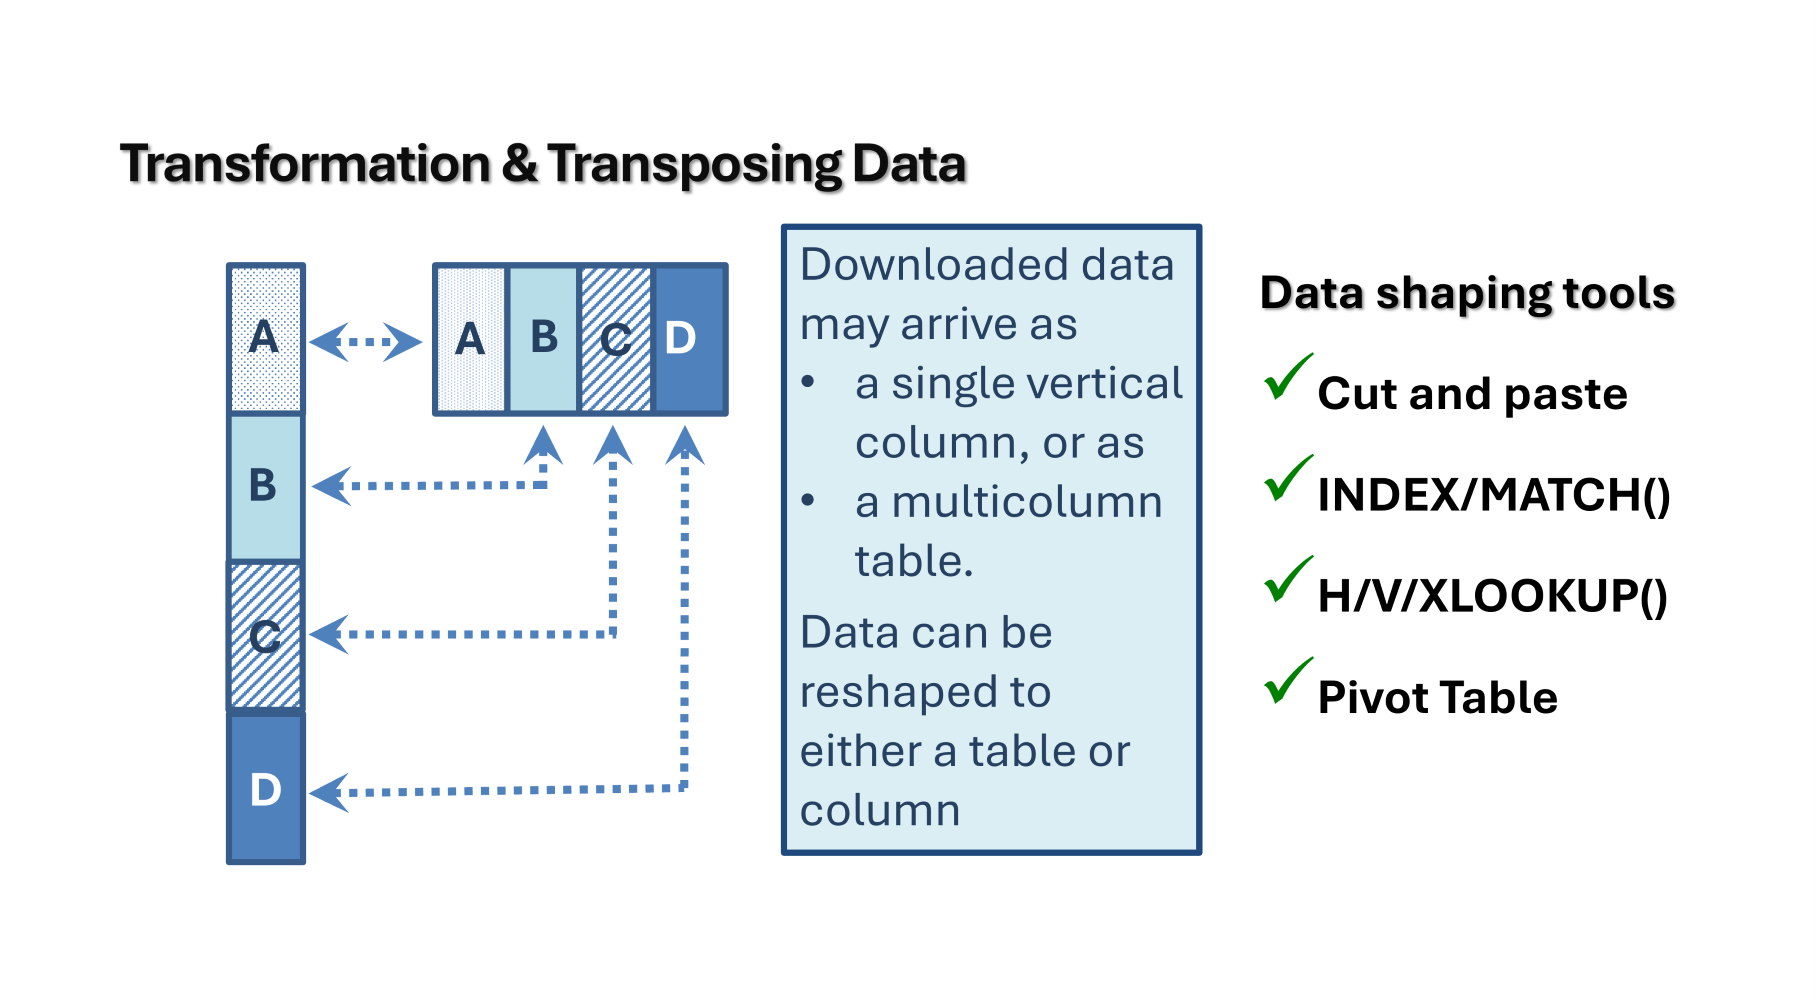
The other night, plans were laid to walk readers through transforming data. The Bureau of Labor and Statistics (BLS) historical file of the Consumer Price Index (CPI) was downloaded as a base file. In a few hours, the data was cleaned and transposed from a table with years in rows and 12, columns of monthly CPI values; to a single column of monthly CPI data by year. I used the first 3 of the techniques in this illustration: 1) cut and pasting, 2) a nested INDEX/MATCH() function, and the old standby, 3) VLOOKUP() function.
It is difficult to communicate all the steps in a single flat file with one image like these blog posts. This is motivating a shift in information delivery to multi-image carousels or videos. But we can start today by getting the most current CPI data file and cleaning it up for our purposes.
The Consumer Price Index (CPI) is the BLS performance measure that allows inflation to be tracked. There are different versions released by BLS, but there are also other federal tools used to track changes in price levels. The powerful portal for historical CPI data is the Archived Consumer Price Index Supplemental Files page. As of this post, the most current CPI release is for April 2025. Those files show up at the top of the page. The link we are interested in is the next to last link before the March 2025 data. It is the Historical CPI-U (CPI for all Urban Consumers, US City Average (not seasonally adjusted)), April 2025. Clicking on the XLSX link will begin the download.
- Go to the BLS link. Click on that link. Save the file, in this case, historical-cpi-u-202504.xlsx, somewhere on your system, and open it. The file comes with 2 worksheets. The one we are interested in is the left most worksheet, All items index level.
- Make a copy of this sheet using the Move or Copy… option after right-clicking on the worksheet tab. A recent post, Sheets Happen, …But Not Automatically – What the Function, describes the steps to make worksheet copies. Excel automatically adds a number in parenthesis behind each copied name. The purpose of making a copy is to create a backup of the original data in case there is a fatal innovation that necessitates starting over. My naming protocol is to name the original copy the original by adding a ‘-00’ to the existing name. Subsequent worksheet names that are created usually indicate the nature of the innovation for that worksheet. The consistent ‘-00’ protocol identifies the original, if it is needed.
- For the purposes of the data transformation exercises we are going to get rid of everything in the downloaded file that we do not need. Preparing a raw file for analysis is called ‘cleaning’. It is a hedge against spreadsheet errors when all the data is consistent and uniform before beginning. We will be using monthly CPI values from January 2000 to April 2025.
Rows and columns can be deleted when they are highlighted from the row or column header (as opposed to highlighting contiguous cells). Cleaning this file means:
-
- Highlight rows 1-3 (original file labels) and delete rows 1, 2, and 3.
- Reduce Column B margin width.
- Delete Column A.
- Delete the rows containing the years 1913 to 2000.
Be sure to save the file if it is not set to automatically save.
There are a couple of important things to note about the BLS file we downloaded.
- The years in Column A, are characteristically pinned to the left side with the green triangle in the upper left corner of each year’s cell. This indicates the year data is formatted as text. Even though it looks like a number it has no numeric value. As text, it cannot be used as a number. It can be converted, but for our purposes, this will work for us.
- The column headings are 3-character month abbreviations. As an abbreviation the BLS has placed a period at the end of each abbreviation. The month of May only has 3 characters in its name, so there is no period.
- Both of these bits of information will play a role in the following data transformation exercises.
A video on how to download this data is available through this link.
This CPI dataset is ready to use whether reshaping it is important to you or not. The BLS link will provide this data later in the future.
Comments
Excel Data Shaping Fundamentals File Prep – What the Function — No Comments
HTML tags allowed in your comment: <a href="" title=""> <abbr title=""> <acronym title=""> <b> <blockquote cite=""> <cite> <code> <del datetime=""> <em> <i> <q cite=""> <s> <strike> <strong>