Annual and Daily Solar Production from a Residential Array – Making $ense of Energy
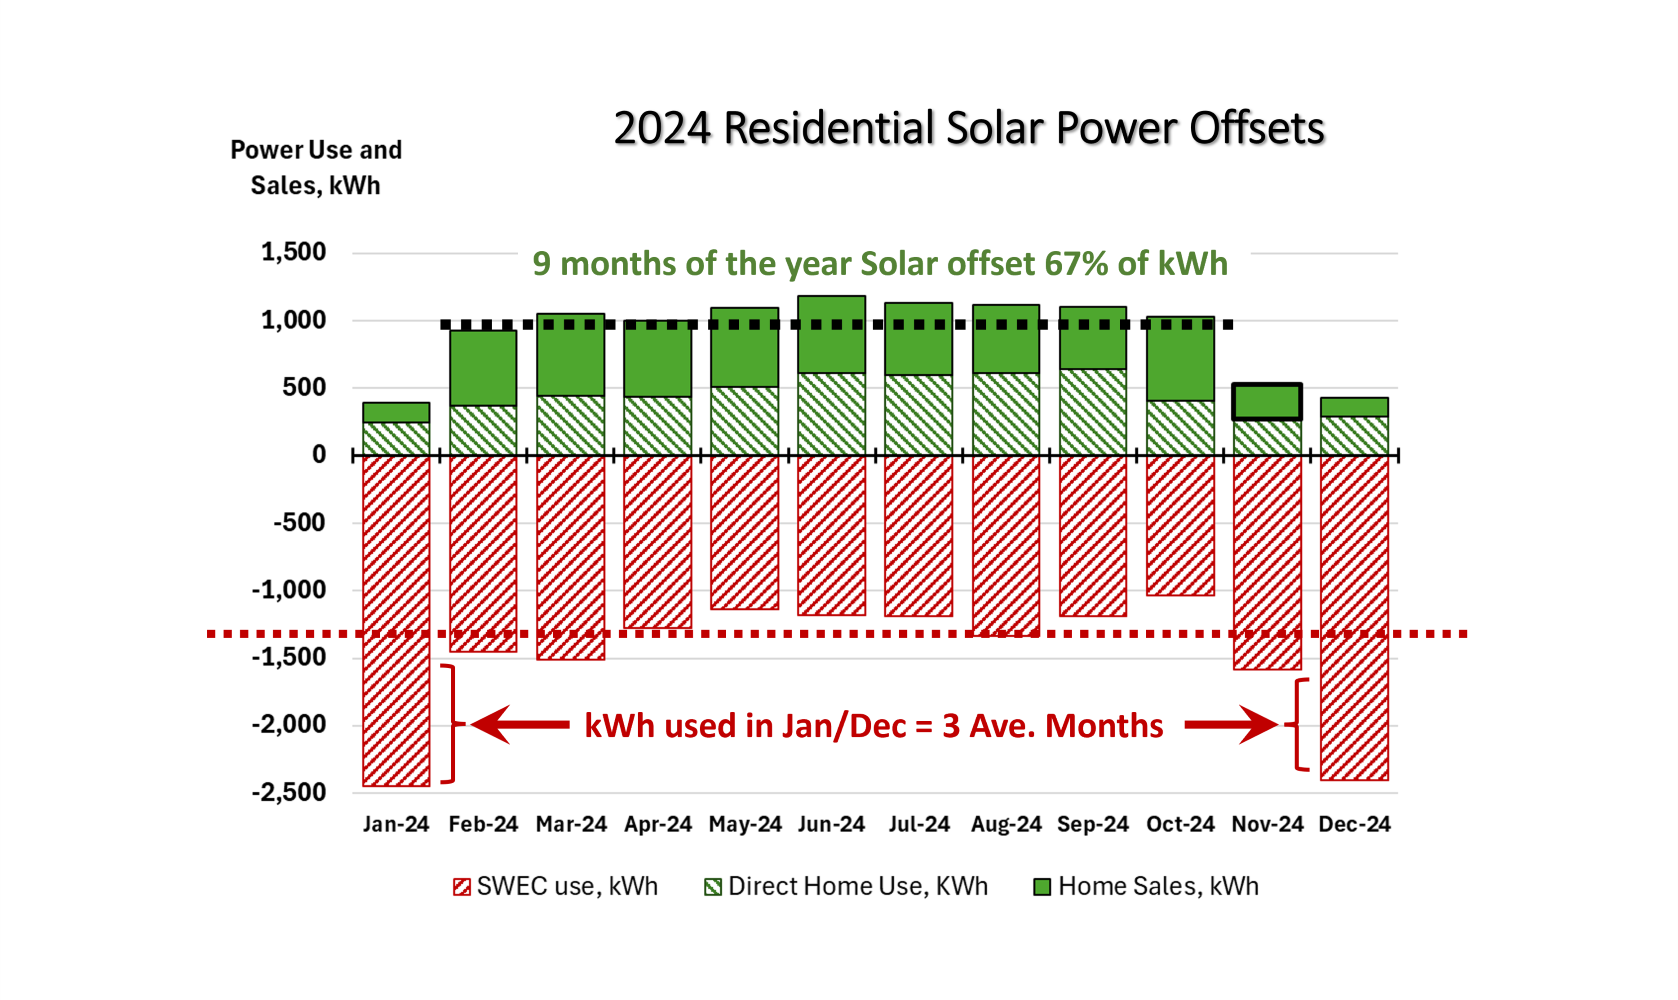
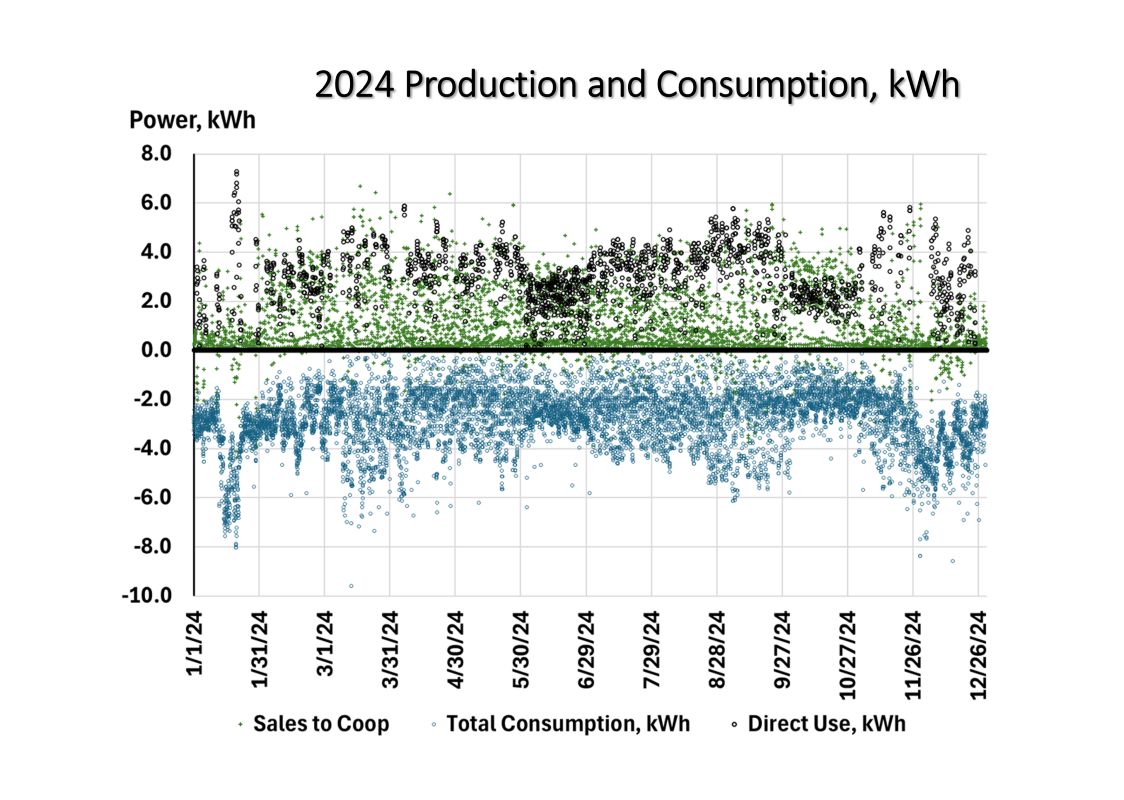
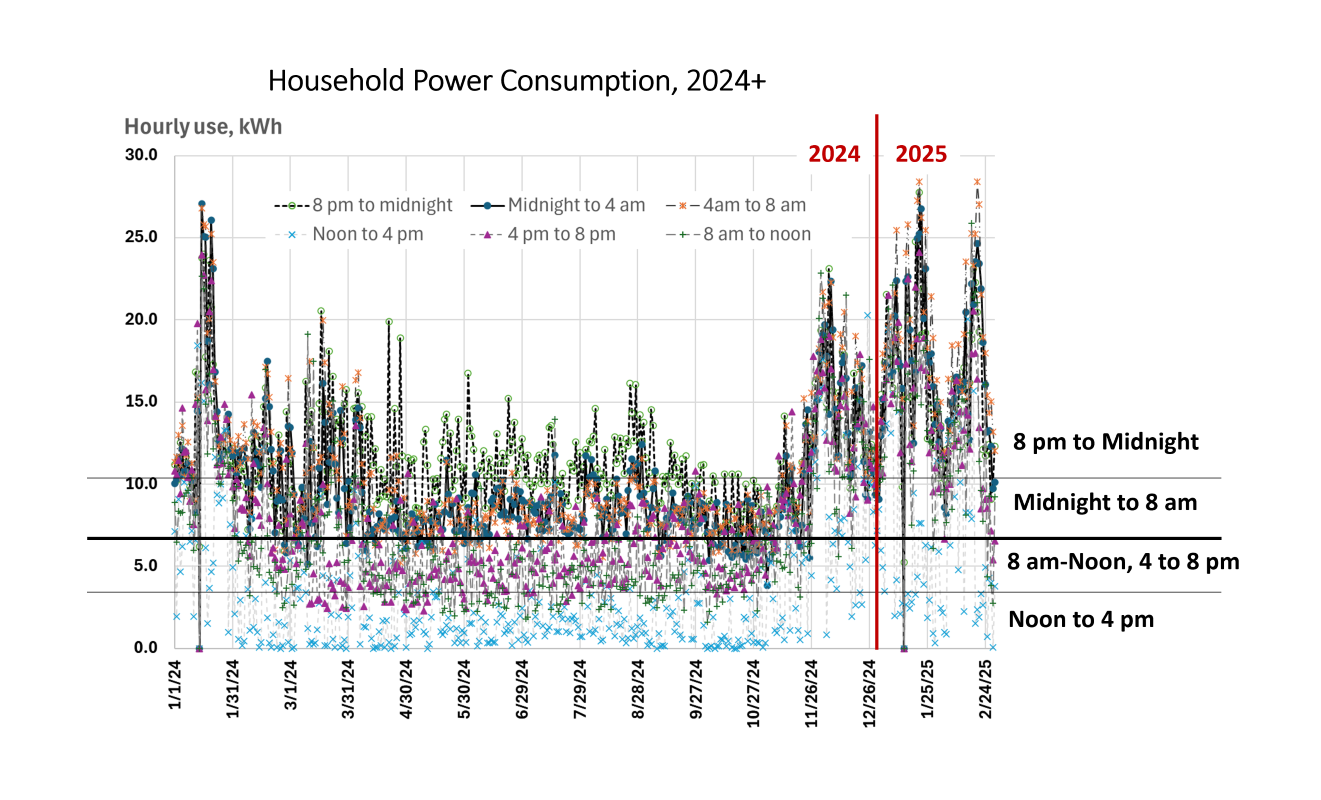
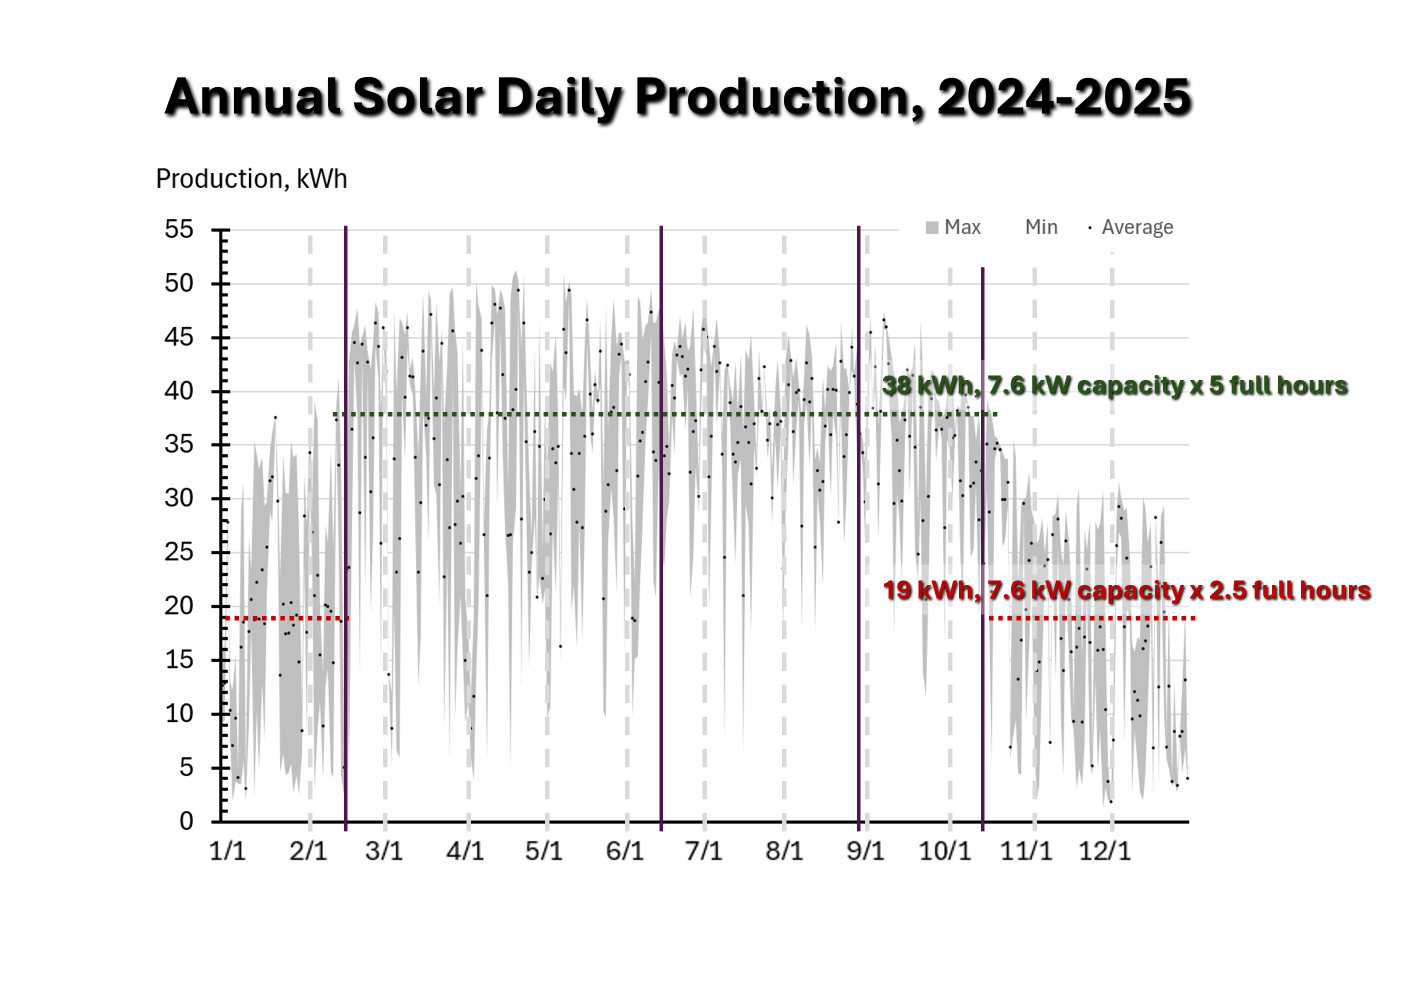
Biomass Rules has been collecting solar production data every 5 minutes for the last 30 months (40,000 sunlight datapoints per year). The most surprising discovery is the variability. Solar output on any single day is highly variable. Most days, it … Continue reading →