

24 Months of Power Production on A Residential Solar Array – Making $ense of Energy
The first week of July (2026), the previous 24 months of solar panel output were presented in the post, Annual and Daily Solar Production from a Residential Array – Making $ense of Energy. The greatest surprise was the high variability in solar availability on any given day, as well as the solar installers coming very close to predicting the design capacity of 10,000 kWh (kilowatt hours) per year even with extreme variability.
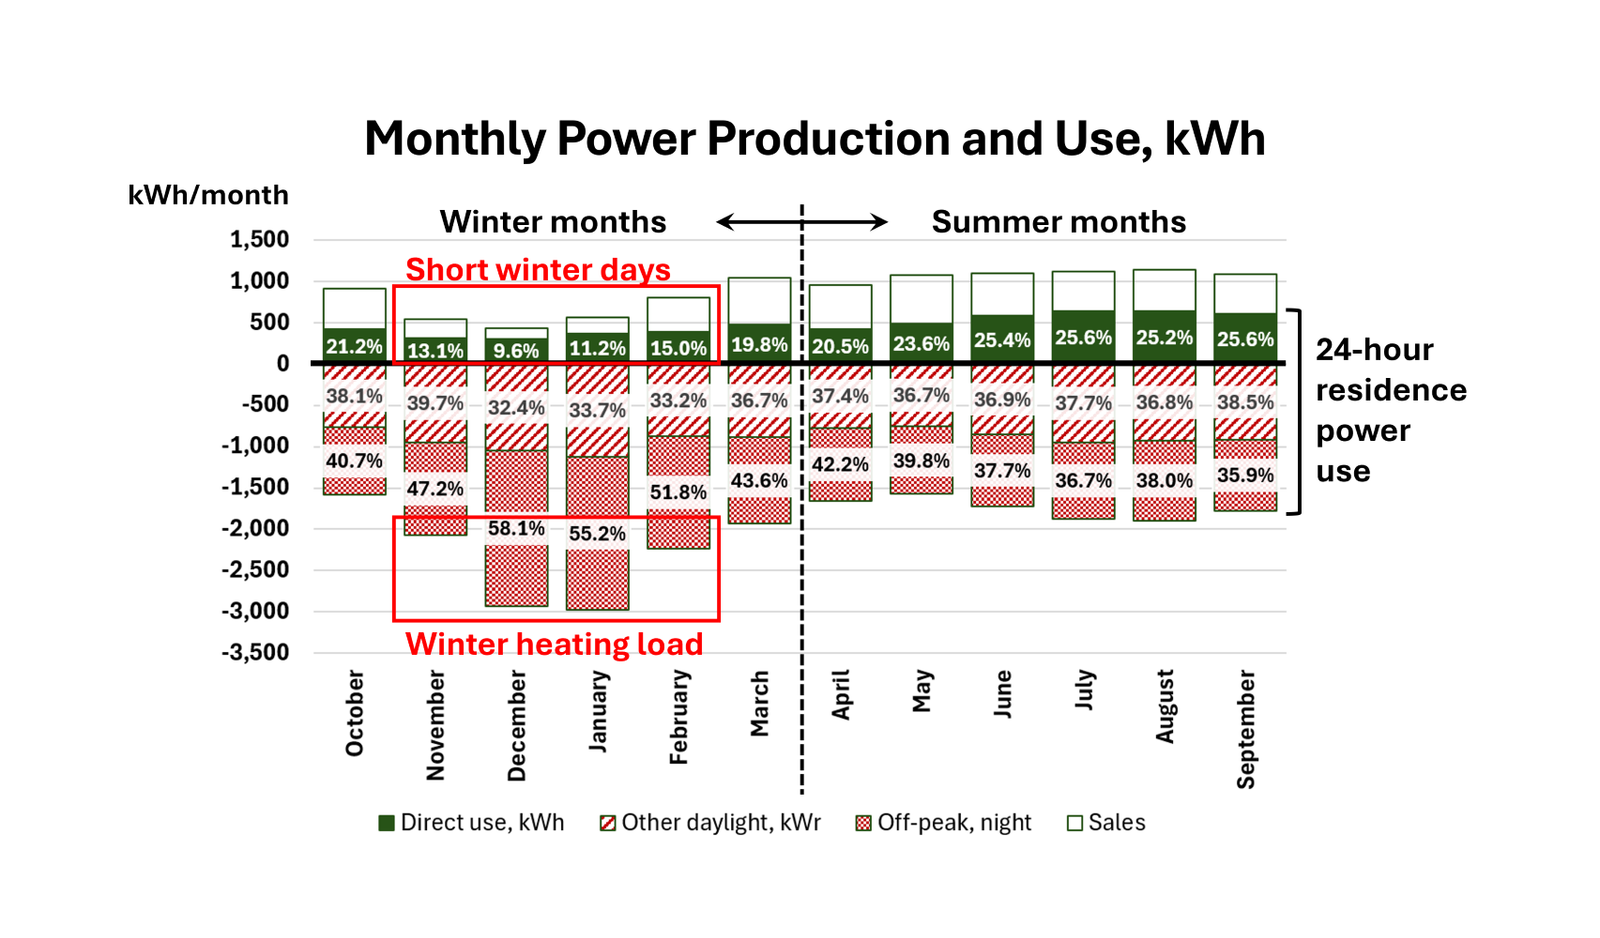
This article unpacks the kWh power consumption of our household. The two years of hourly direct solar use and utility purchased power have been averaged into a monthly value. Each month represents a specific hourly consumption in kWh for that month in 2024 and 2025.
Total consumption = direct from solar panels + power purchased from utility.
The top area of each bar represents total kWh sold to the power company. If we do not consume the available solar power directly, it is purchased by the power company. Curiously, the sales to the electric cooperative represent production that was greater than our direct consumption. This happens unevenly on very bright sunshiny days in which household consumption is not high. Over the month, there are days when all production is used directly and days when solar output is greater than our direct use. On average both mutually exclusive events occur. Our utility does not pay much for purchased power, so it benefits our household more to use it directly offsetting the full cost of each purchased kWh.
A similar chart of annual consumption was posted in May 2025 with just the 2024 power consumption data. This post’s current chart begins with the month of October and ends in September. This provides a visual of six winter months on the left and six summer months on the right. Other important aspects of this chart include:
- The zero kWh vertical axis provides a delimiter between solar production on site (green and positive kWh), and power purchased from the electric cooperative (maroon and negative).
- The difference between the power consumption chart posted last year and this year’s chart is the daylight hours are segregated out for each 24-hour day. Direct use + Other daylight hours account for the length of daylight varying from winter to summer. The sun only shines during the daylight hours.
- Non-daylight power consumption is also identified. Forty percent of household power is consumed after the sun goes down in the summer. It is even greater in the winter, greater in both increased kWh and as a share of consumption after dark.
The winter months are difficult for 1) the residential geothermal heat pump and 2) solar power based on less available solar energy. We supplement some of our winter heat production with a standard ambient air fireplace, but it does not provide significant heat offset for the home.
The timing of our power use is changing over time. Every year, we do better at running our appliances and charging our batteries during daylight hours. All of our mowing, chainsaws, and trimming are done with solar powered equipment. We air-dry our laundry during the months when the daytime temperature is above 50 degrees. And we are always evaluating potential leaks through open doors and windows.
Solar panels provide one way to be less dependent on rising power costs. Interestingly, in the last 60 months our cooperative kWh prices have not increased. But our total power bills divided by the kWh used each month (total costs/kWh) have increased about 3 percent. The calculations for producing renewable power in a residence are not simple. Still, for us, we are glad for the diversified sourcing of our power supply and usage.
Comments
24 Months of Power Production on A Residential Solar Array – Making $ense of Energy — No Comments
HTML tags allowed in your comment: <a href="" title=""> <abbr title=""> <acronym title=""> <b> <blockquote cite=""> <cite> <code> <del datetime=""> <em> <i> <q cite=""> <s> <strike> <strong>