
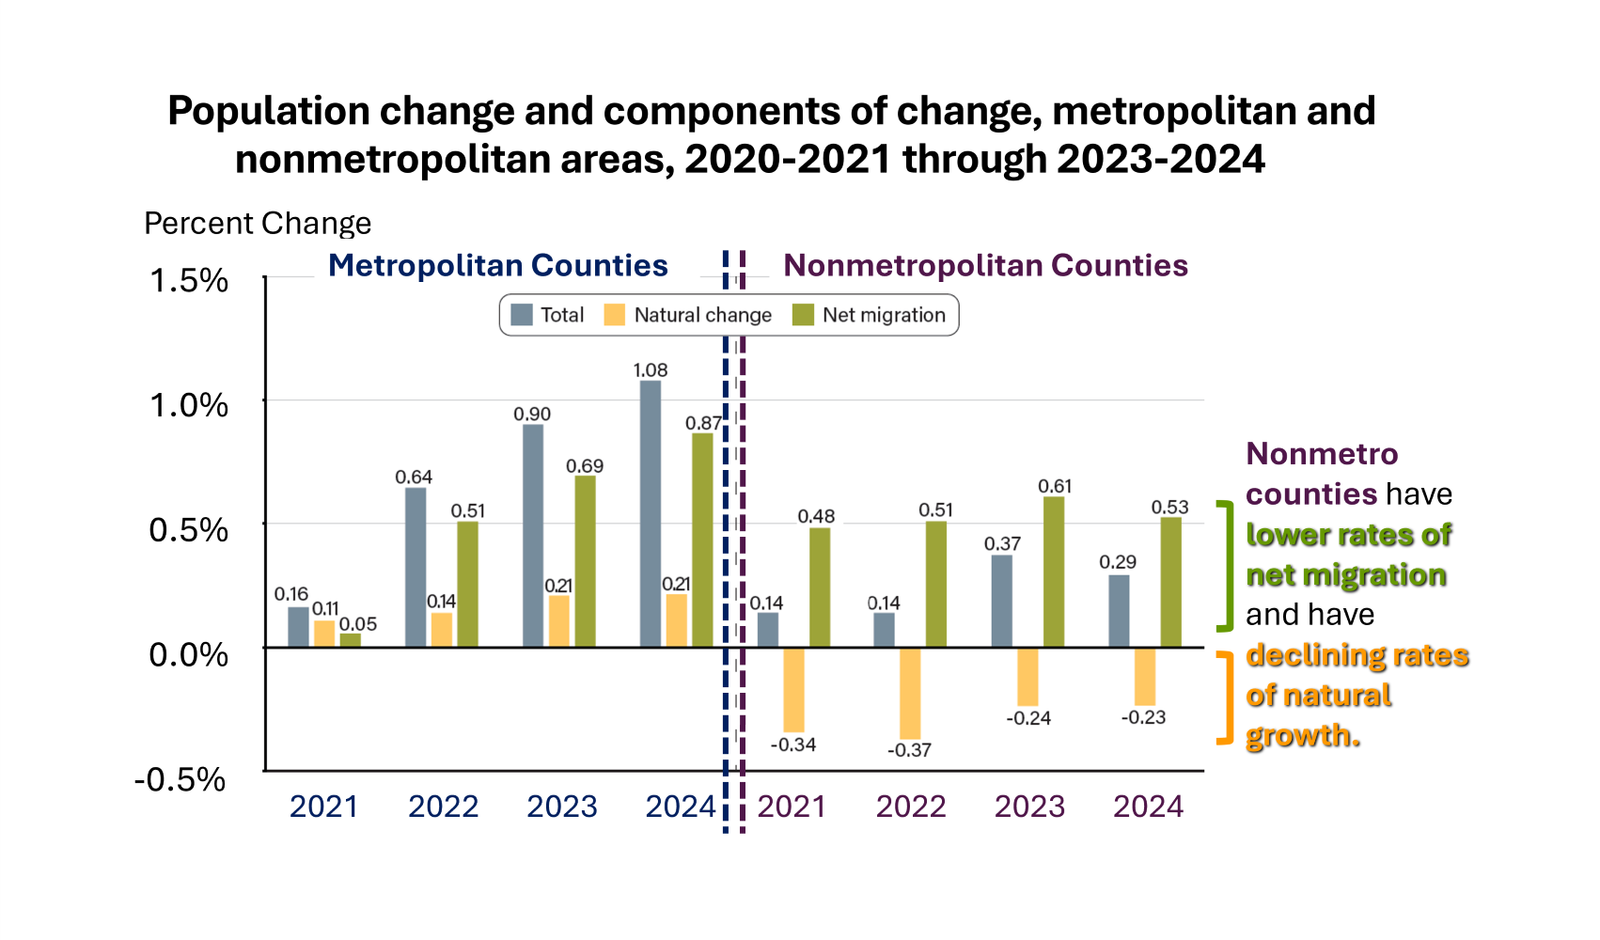
Negative Population Growth in US Rural Nonmetropolitan Counties
In January 2026, the USDA, Economic Research Service (ERS) published the latest update of Rural America at a Glance: 2025 Edition. The companion chart to this post is from that publication, but is also the same chart that was published … Continue reading →
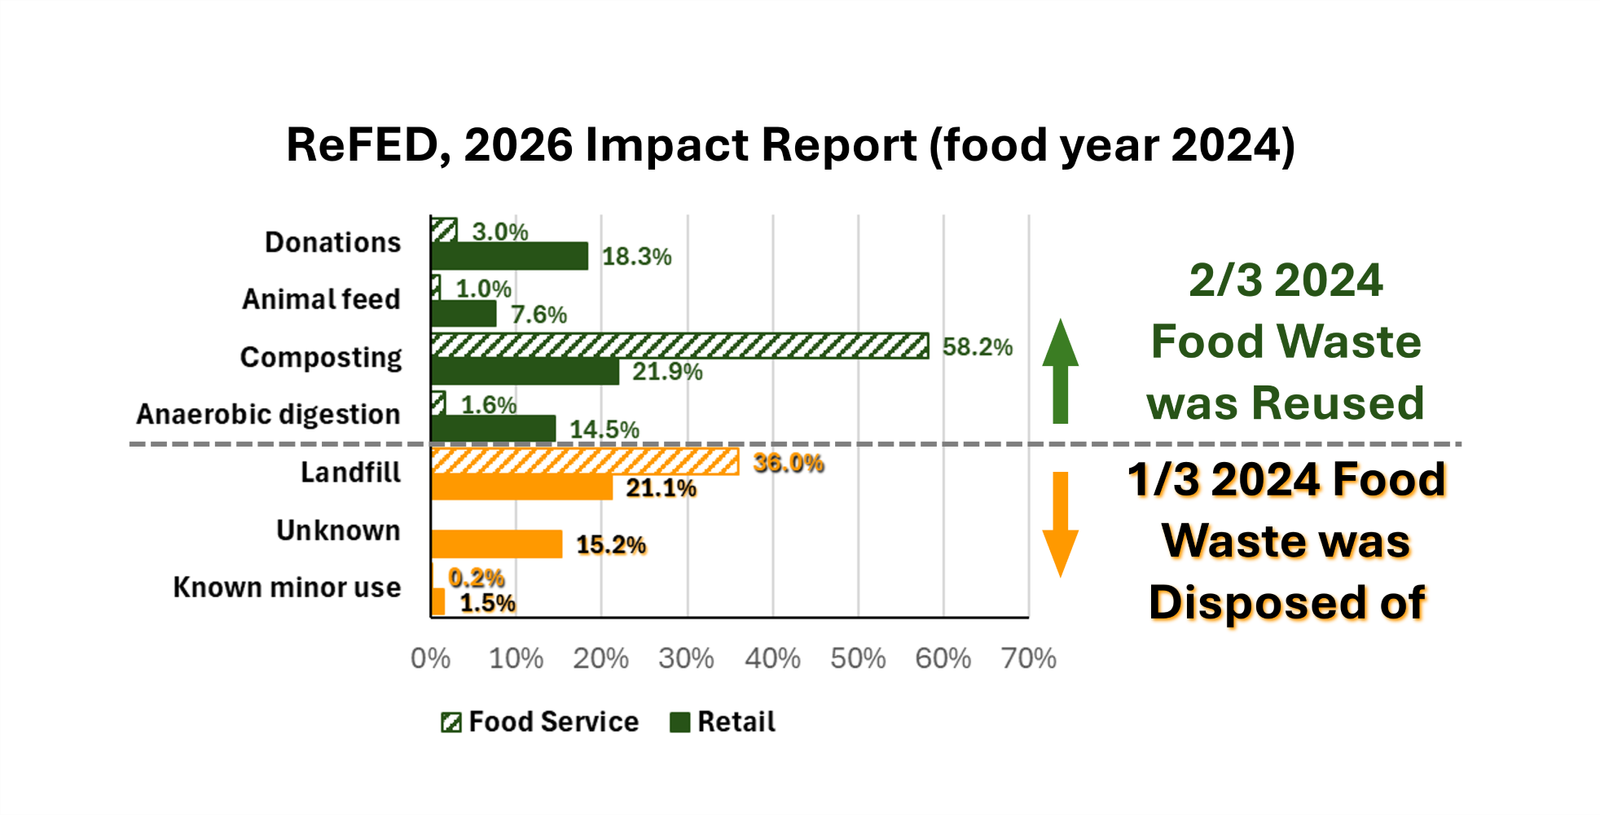
Unpacking the Latest ReFED Food Waste Impact Findings
Last year, I became aware of ReFED.org and their work on food waste. Their report, “From Surplus to Solutions: 2025 ReFED U.S. Food Waste Report,” was popular in the food waste circles. It is an impressive document and an even … Continue reading →
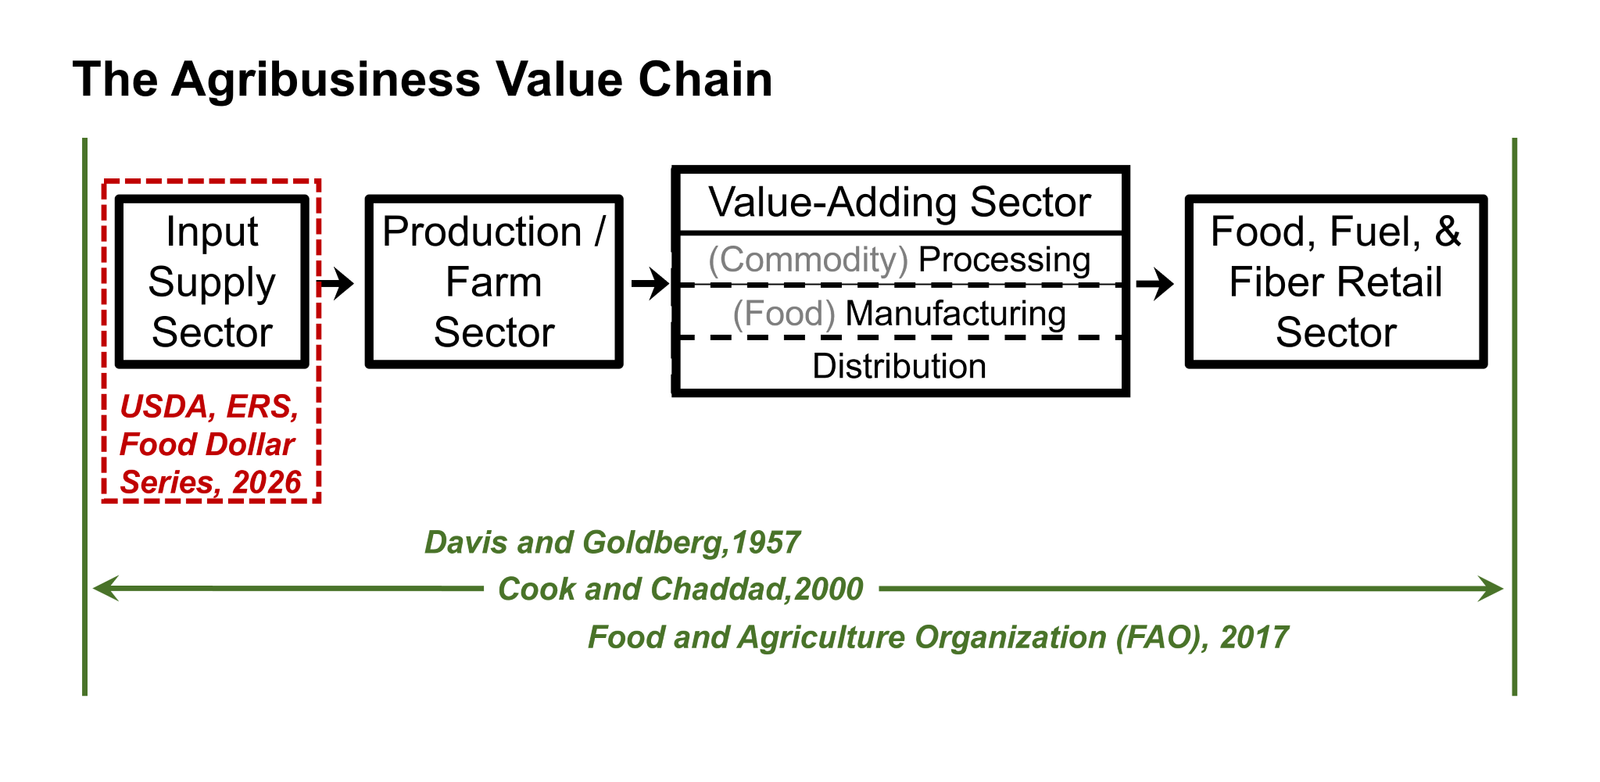
National Ag Day and the Role of Agribusiness in the Economy
In celebration of National Ag Day, March 24, 2026, we are rallying from a winter of light blog posting, to recognize agribusiness’ role in the US economy. There is general consensus about the scope of the agribusiness industry, except within … Continue reading →
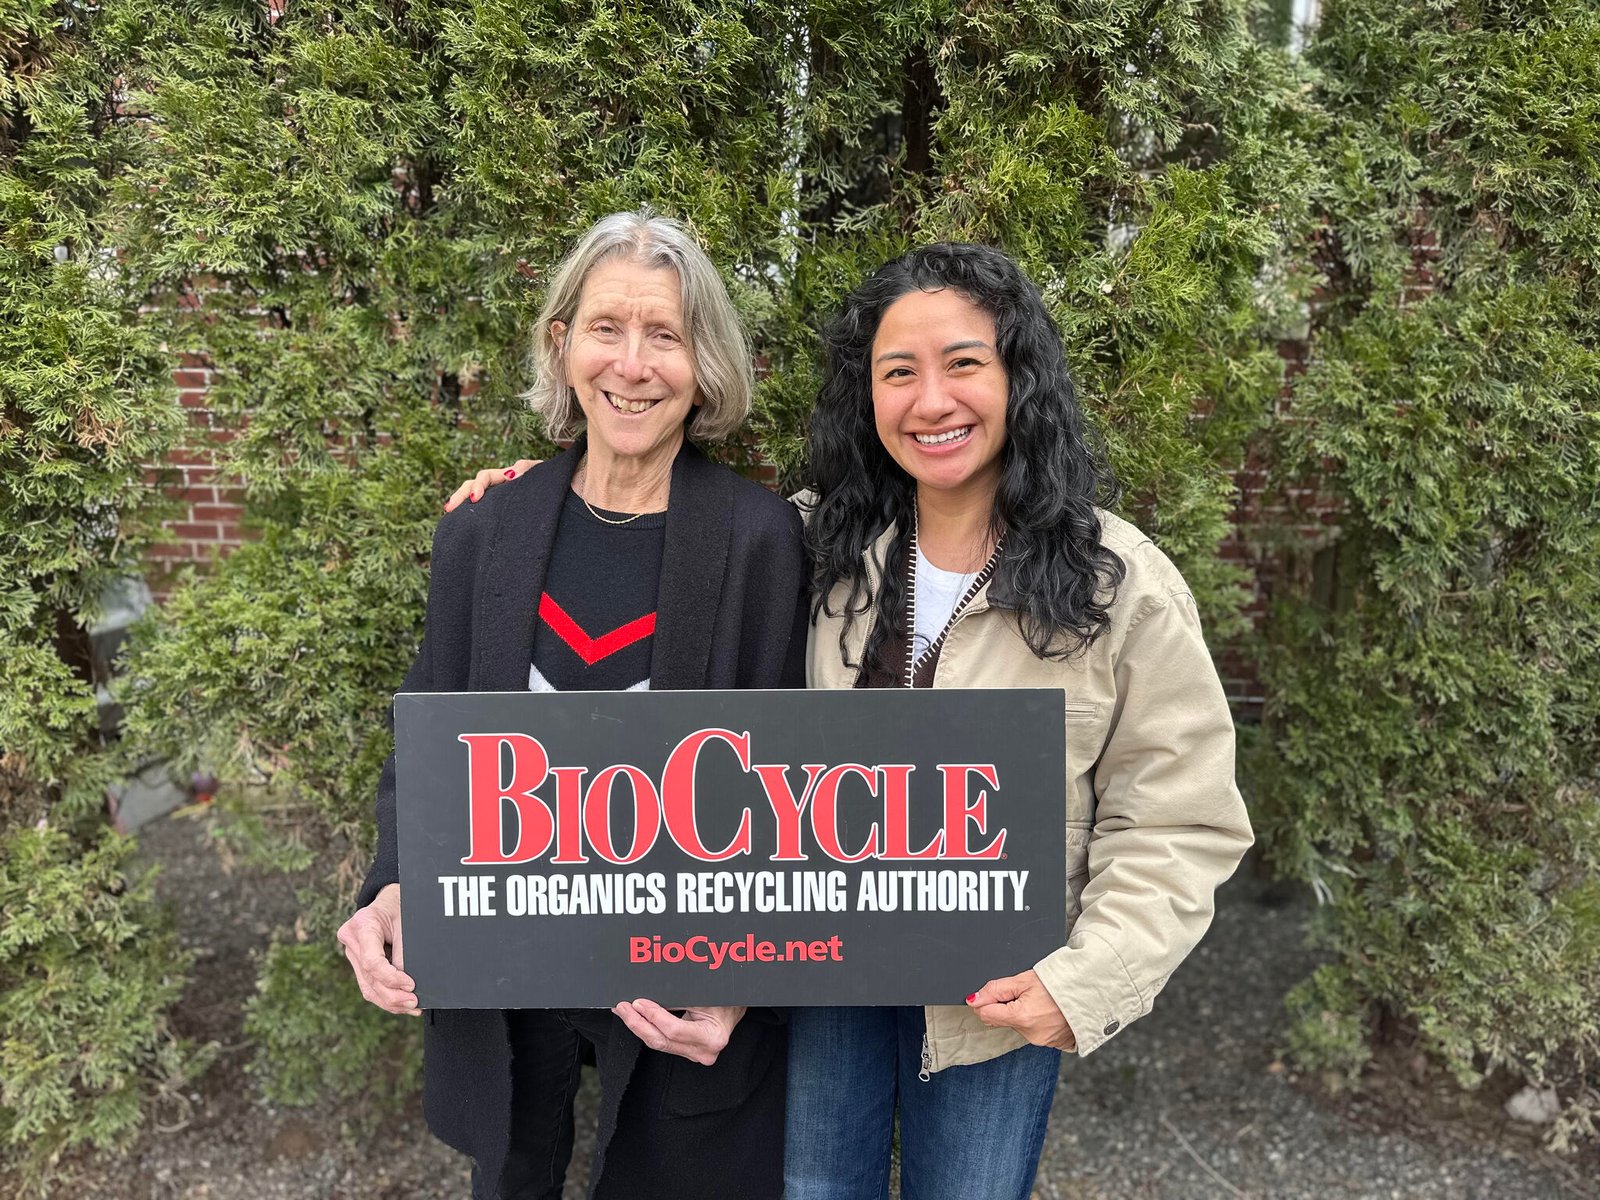
Nora Goldstein and the BioCycle Legacy Continue
This news of Nora Goldstein’s changing role at BioCycle came out two weeks ago and it was too important not to circle back. I am grateful to have had the chance to work and learn together with Nora Goldstein and … Continue reading →

The Unsung Role of Gravity in Residential Energy System Operation
Gravity is underrated in our world. It is taken for granted in residential energy systems. As an agricultural systems analyst we design our systems using gravity whenever possible. In, Grain and feed handling Liquid and dry manure handling Barging grain … Continue reading →

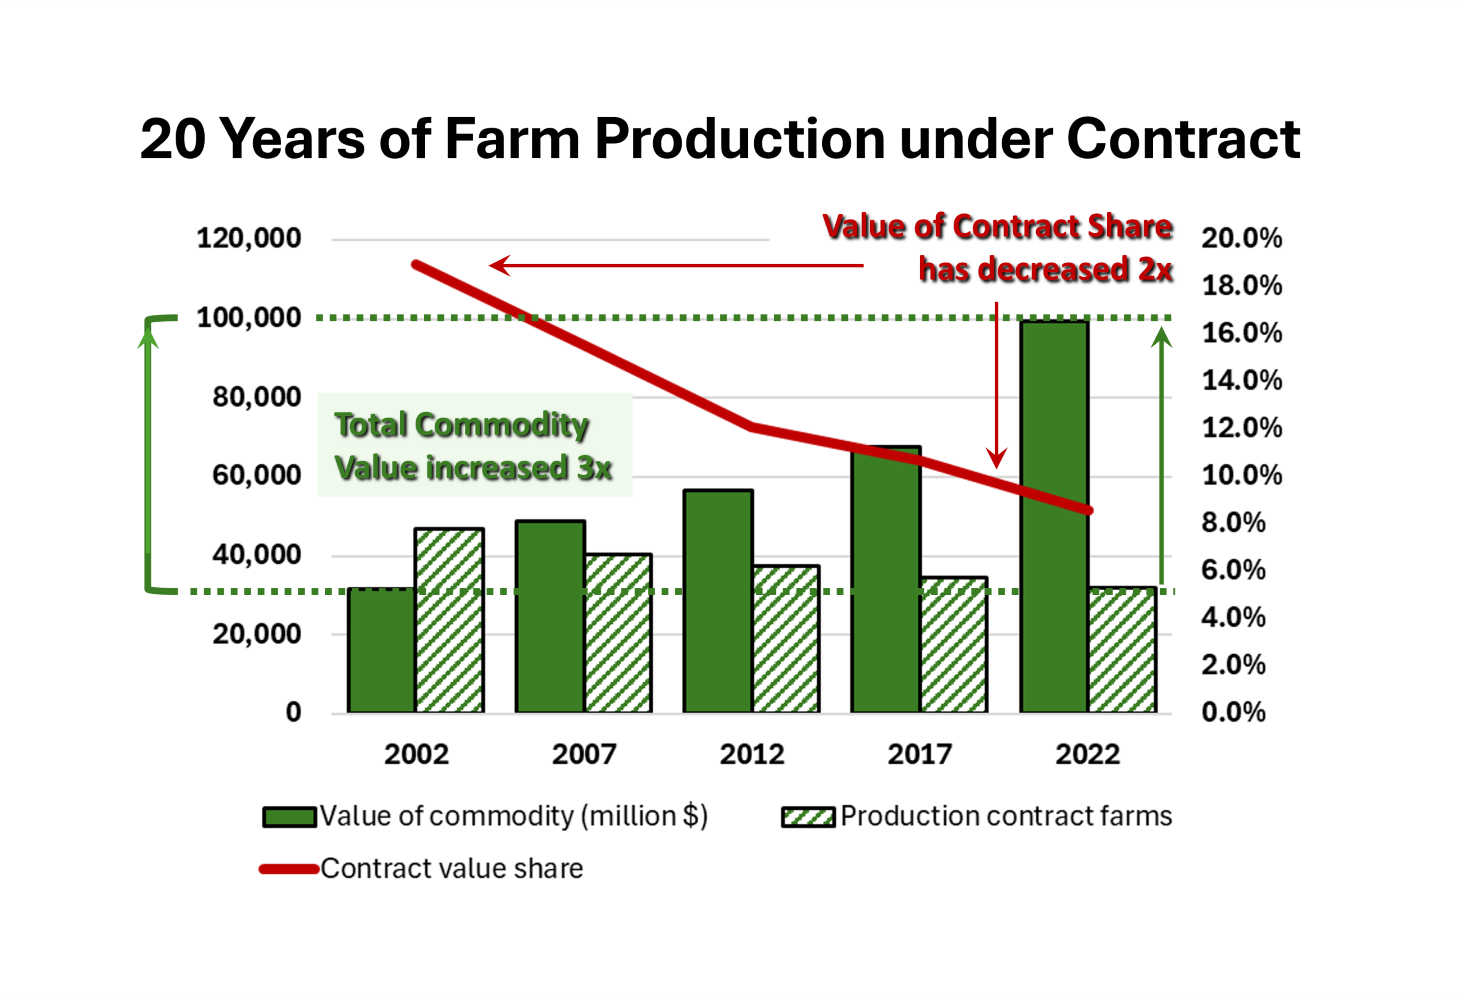
Three Flavors of Production Information Aid Farmers in January 2026
I am a fierce advocate for farms and farming. But what is a farm? And who is a farmer? There are lots of social media posts on this topic. I write often on this topic and have asked these questions … Continue reading →
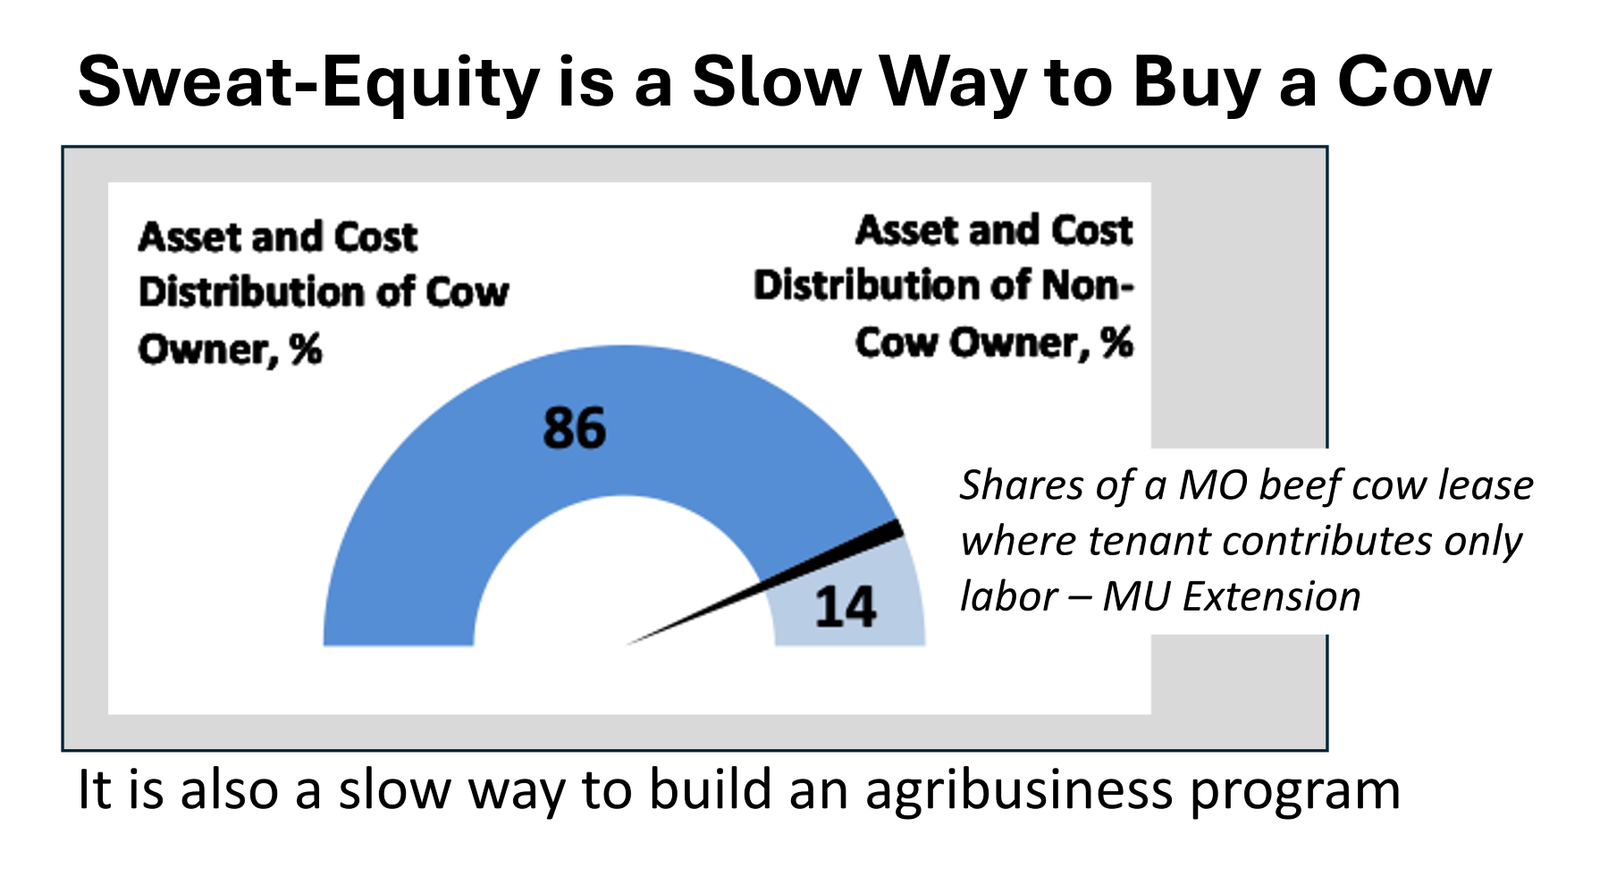
Buying a Farm with the Sweat of One’s Brow is an American Dream
It is also a slow way to build capital. While I was in high school, I remember one of our farm neighbors, built a commercial hog farm largely on his spirit and work ethic. Several large farmers helped cover his … Continue reading →
Industry Terminology has a Powerful Policy Impact – Definitive Power
I had the unique privilege of being hired by the American Farm Bureau Federation in 1995 – straight out completing my PhD – because I had three graduate degrees in manure management. My other Farm Bureau responsibilities included eggs, … Continue reading →
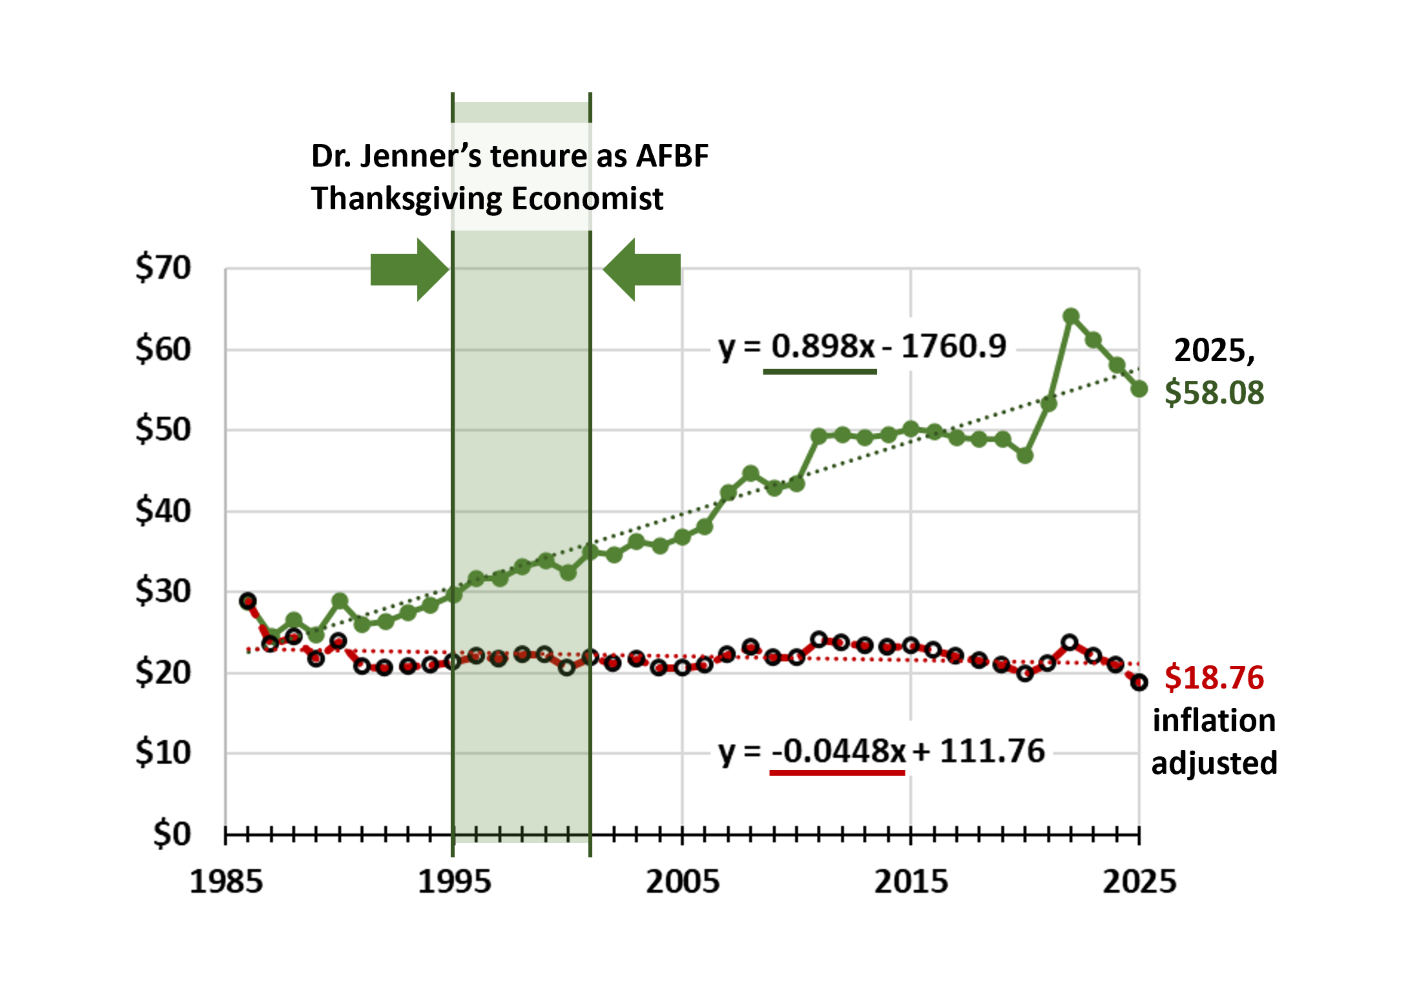
For 40 Years, Real Cost of Thanksgiving Meal Price Remains Constant
Serving as the American Farm Bureau Federation’s Thanksgiving economist in the 1990s was a pleasure. The cost of food thirty years ago was generally good news, so there was no downside. Unlike most of the more contested issues I worked … Continue reading →
US Turkey Growers Do Not Receive Same Market Benefit as the Industry
Thanksgiving arrives with an annual focus on food prices. We host friends and family at home with lots of prepared food. One of the annual food price traditions is the American Farm Bureau Federation, Thanksgiving Survey. Regular readers know that … Continue reading →