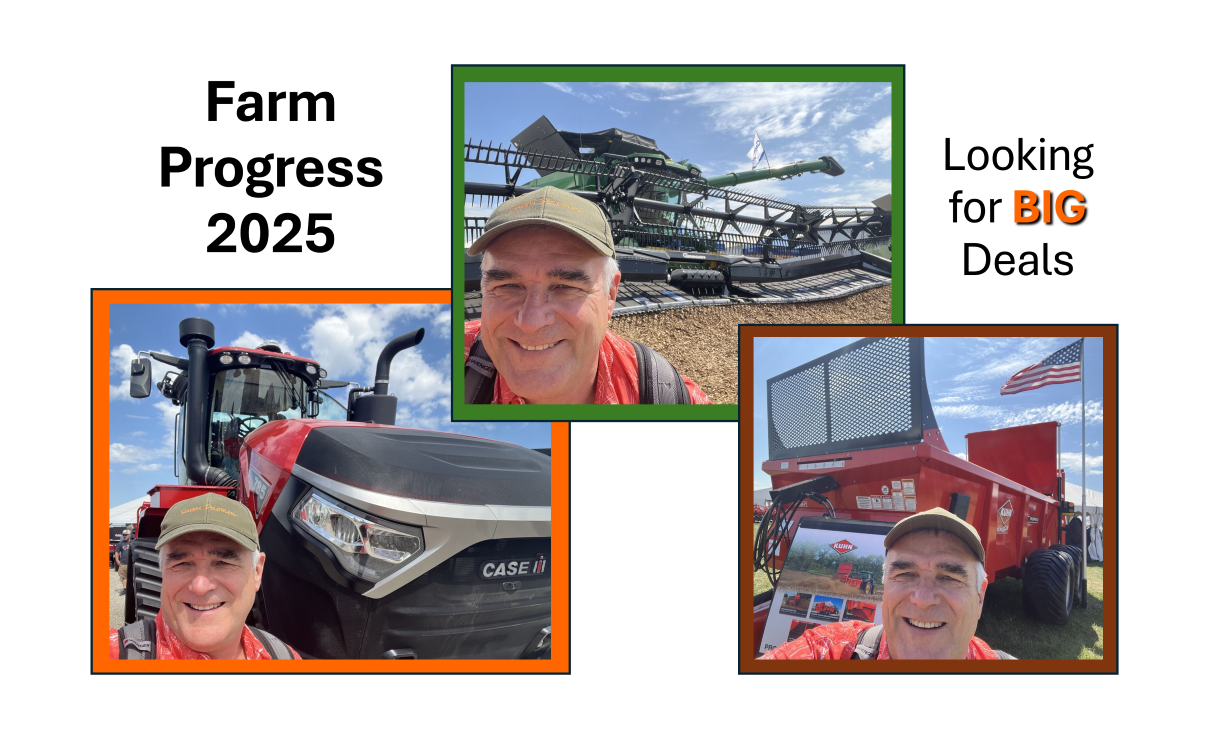
↓
 
Biomass Rules

Biomass Rules

Adding Clarity to All Things Bio!

Biomass Rules
  • Home
  • About Biomass Rules
  • Contact Biomass Rules
  • Biomass Links that Rule
  • Everything BIO
  • Bio-Blog

Category Archives: firm

Post navigation

← Older posts
Newer posts →

Growing Your Influence by Rob Clark is a Great Resource!

Biomass Rules Posted on June 6, 2025 by Mark JennerJune 6, 2025

A cool thing happened to me a few years ago.  Rob Clark, of The Tall Family, moved into my community.  At the time, I didn’t know anything about The Tall Family, with billions of views on multiple social media platforms.  … Continue reading →

Posted in economics, education, firm, policy, Secret Life of Rural Communities, wealth creation | Tagged accounting, business, costs, enterprise, Greenville University, Growing Your Influence, Growing Your Influence by Rob Clark is a great resource, how to begin, influencer, marketing, mission, operations management, performance measures, readable, relevant, revenues, Rob Clark, social media, The Tall Family | Leave a reply

Home Solar Array Offsets Two-Thirds of 2024 Power Consumption-Making $ense of Energy

Biomass Rules Posted on May 16, 2025 by Mark JennerMay 16, 2025

After all is said and done, this residential solar array in the non-winter months offset 67 percent of home power production.  This chart is monthly solar production and household consumption in kilowatt hours (kWh).  While it required both the solar … Continue reading →

Posted in analytics, economics, education, firm, Making $ense of Energy, policy, production, science | Tagged cloudy days, consumption, direct offset, early morning and late evening limited light, home solar array offset two-thirds of 2024 power consumption, incremental additions, kilowatt-hours (kWh), Making $ense of Energy, making sense of energy, production, small wind and hydro, solar power, solar sales, solar sales one third of power price, utility power consumption | Leave a reply

Selecting Meaningful Labels for 130,000 Data Points – What the Function

Biomass Rules Posted on May 7, 2025 by Mark JennerMay 7, 2025

A year contains half a million minutes.  The residential solar panel data arrived in five-minute increments, or about 20 percent of the annual minute universe.  Adding in the utility generated data, the two data sources delivered about 130,000 data points. … Continue reading →

Posted in analytics, definition, economics, firm, policy, production, science, What the Function | Tagged $ sign anchor, annual data, cell address, columns, day, files, five-minute intervals, hour, kilowatt-hour (kWh), kilowatts (kW), month, rows, selecting meaningful labels for 130000 data points, sheet address, sheets, solar panel data, watts, what the function, year | Leave a reply

Forensic Modeling to Bridge Dataset Gaps – Making $ense of Energy

Biomass Rules Posted on May 1, 2025 by Mark JennerMay 2, 2025

Modeling tools are used for more than forecasting.  To complete the analysis of household energy consumption, forensic data modeling was required.  Data from two different datasets were needed, and was in slightly different formats that prohibited a smooth alignment. The … Continue reading →

Posted in analytics, definition, economics, firm, Making $ense of Energy, policy, production, science | Tagged data is powerful, daylight hours, forensic modeling to bridge dataset gaps, household power correlated to ambient temperature, important to wallow in the data, kW, kWh, Making $ense of Energy, making sense of energy, math is cheaper than technology (primary data collection), multi-source data can be combined, non-daylight hours, solar panel power, solar sales to utility, utility-provided power, weighted factors | Leave a reply

Mapping 10,000 Points of Hourly Power Use – Making $ense of Energy

Biomass Rules Posted on April 29, 2025 by Mark JennerApril 29, 2025

In February, I asked my Electric Cooperative for help in understanding our solar panel output for 2024.   They responded with 10,000 data hourly power consumption points over the 12 months of 2024 and the first two months of 2025. As … Continue reading →

Posted in analytics, economics, firm, Making $ense of Energy, policy, production, Renewable Fuel, science | Tagged 5-minute increment, daily, daylight, demand, electric cooperative, historical data, hourly, hypothetical data, kilowatt (kW), Making $ense of Energy, making sense of energy, mapping 10000 points of hourly power use, modeling total household demand, monthly, nighttime, off-peak, sales, solar offsets, solar production, supply | Leave a reply

Comparative Monthly Solar Output – Making $ense of Energy

Biomass Rules Posted on April 21, 2025 by Mark JennerApril 21, 2025

This post continues the deeper dive into power production of a residential solar array.  The last post on solar output looked at daily variability of this solar array in June 2024.  Variability from cloud cover in this geographic location, 45 … Continue reading →

Posted in economics, farm, firm, Making $ense of Energy, policy, production, science | Tagged 12 hours of darkness, 12 months, 2024, 24-hours, 25 percent of daily hours, 70 percent of capacity, cloud cover, comparative monthly solar output, counter-intuitive, daily variability, effective peak production, intuitive, kilowatts, less intuitive, Making $ense of Energy, making sense of energy, monthly variability | Leave a reply

Comparing Micro Household Food Costs to Macro CPI Food, Food Price Fun

Biomass Rules Posted on April 9, 2025 by Mark JennerApril 9, 2025

The Bureau of Labor and Statistics (BLS) Consumer Price Index (CPI) carries significant weight in the flow of decisions and confidence in the US economy. Does the CPI mirror authentic food purchases?  YES! Are household food expenditures and the Food … Continue reading →

Posted in analytics, economics, education, firm, Food Price Fun, macro, policy, science | Tagged Bureau of Labor and Statistics (BLS), buying in bulk, commercial center competition, comparing micro household food costs to macro CPI Food, Consumer Price Index (CPI), consumer purchasing power, CPI is average prices, food, food inflation, food price fun, food-at-home, food-away-from-home, generic brands, grocery food, household food differs, individual household food, macroeconomic, microeconomic, restaurant food | Leave a reply

Processed Food Grain Purchases for 2024 in Rural Illinois – Food Price Fun

Biomass Rules Posted on March 24, 2025 by Mark JennerMarch 24, 2025

Food Price Fun compares the theory of food prices to practices of buying food.  On the one hand the Bureau of Labor and Statistics (BLS) Consumer Price Index (CPI) food prices provide the benchmark for the macroeconomy of food.  But … Continue reading →

Posted in analytics, economics, firm, Food Price Fun, macro, science | Tagged 2024, branded, competition, Consumer Price Index (CPI), food price, food price fun, generic, macroeconomic, microeconomic, processed food grain purchases, processed food grain purchases for 2024 in rural Illinois, processed grain, remoteness, rural Illinois, rural prices, store brand, urban prices | Leave a reply

The Power of USDA Data in Market Transparency

Biomass Rules Posted on March 14, 2025 by Mark JennerMarch 14, 2025

This chart is from the USDA, Economic Research Service (ERS), USDA Agricultural Projections to 2034, released on 2/18/25.  The 2025 USDA Agricultural Outlook Forum occurred the following week, 2/27-28/25.  This series of events mark the end of the last US … Continue reading →

Posted in analytics, economics, firm, macro, policy, production, science | Tagged Agricultural Projections to 2034, Economic Research Service (ERS), ethanol, export, February 2025, feed and residual, forecast, forward looking, global agriculture, harvest, historical data, intentions, market transparency, planting, power of USDA data, progress, the power of USDA data in market transparency, US agriculture, USDA, USDA Ag Outlook Forum | Leave a reply

The Heartbreak of Highly Pathogenic Avian Influenza

Biomass Rules Posted on March 5, 2025 by Mark JennerMarch 5, 2025

Last Thursday and Friday, (2/27 & 2/28/2025), the USDA held their annual February, Agricultural Outlook Forum in DC.  This marks the start of another growing season.  The February date allows for last year’s crop year data to be tabulated and … Continue reading →

Posted in economics, farm, firm, macro, policy, production, science | Tagged Agricultural Outlook Forum, Chief Economist, declining flock size, declining hens mean increasing egg prices, demand, egg laying hens, heartbreak of highly pathogenic avian influenza, HPAI, increase egg prices, Seth Meyer, sick chickens, supply, USDA | Leave a reply

Post navigation

← Older posts
Newer posts →

Recent Posts

  • Authentic Fun with Arrival of First Copies of My First Book
  • Our Community Loves to Support Our Junior Livestock Show – Secret Life of Rural Communities
  • It is Official. Mark Jenner is a Flaming Nerd.
  • The Legacy Textbook, Principles in Agribusiness Management, is at the Printers!
  • US Producer Age Differs by Farm Enterprise

Mark Jenner, PhD
Biomass Rules
Greenville, IL 62246
c. 618.223.9331
e. biomassrules@gmail.com

Linked In Logo for Mark Jenner's Profile including Biomass Rules.com!

Mission Statement:
Providing solutions through the strategic utilization of all kinds of biomass; the development of new markets for food, fiber, and fuels; and streamlining regulations.

bio·mass:
ˈbī-ō-ˌmas. noun. 1 : the unit area or volume of living matter, 2 : plant materials and animal waste used as renewable feedstocks into new processes.

rules:
'rül. 1: noun. 1 : regulations, bylaws or governing procedure, 2: verb. a : to exert control, direction, or influence on, b : to declare authoritatively.

Manure…
is not a four-letter word.

©2024—Biomass Rules—All Rights Reserved.

↑