Industry Terminology has a Powerful Policy Impact – Definitive Power
I had the unique privilege of being hired by the American Farm Bureau Federation in 1995 – straight out completing my PhD – because I had three graduate degrees in manure management. My other Farm Bureau responsibilities included eggs, … Continue reading →
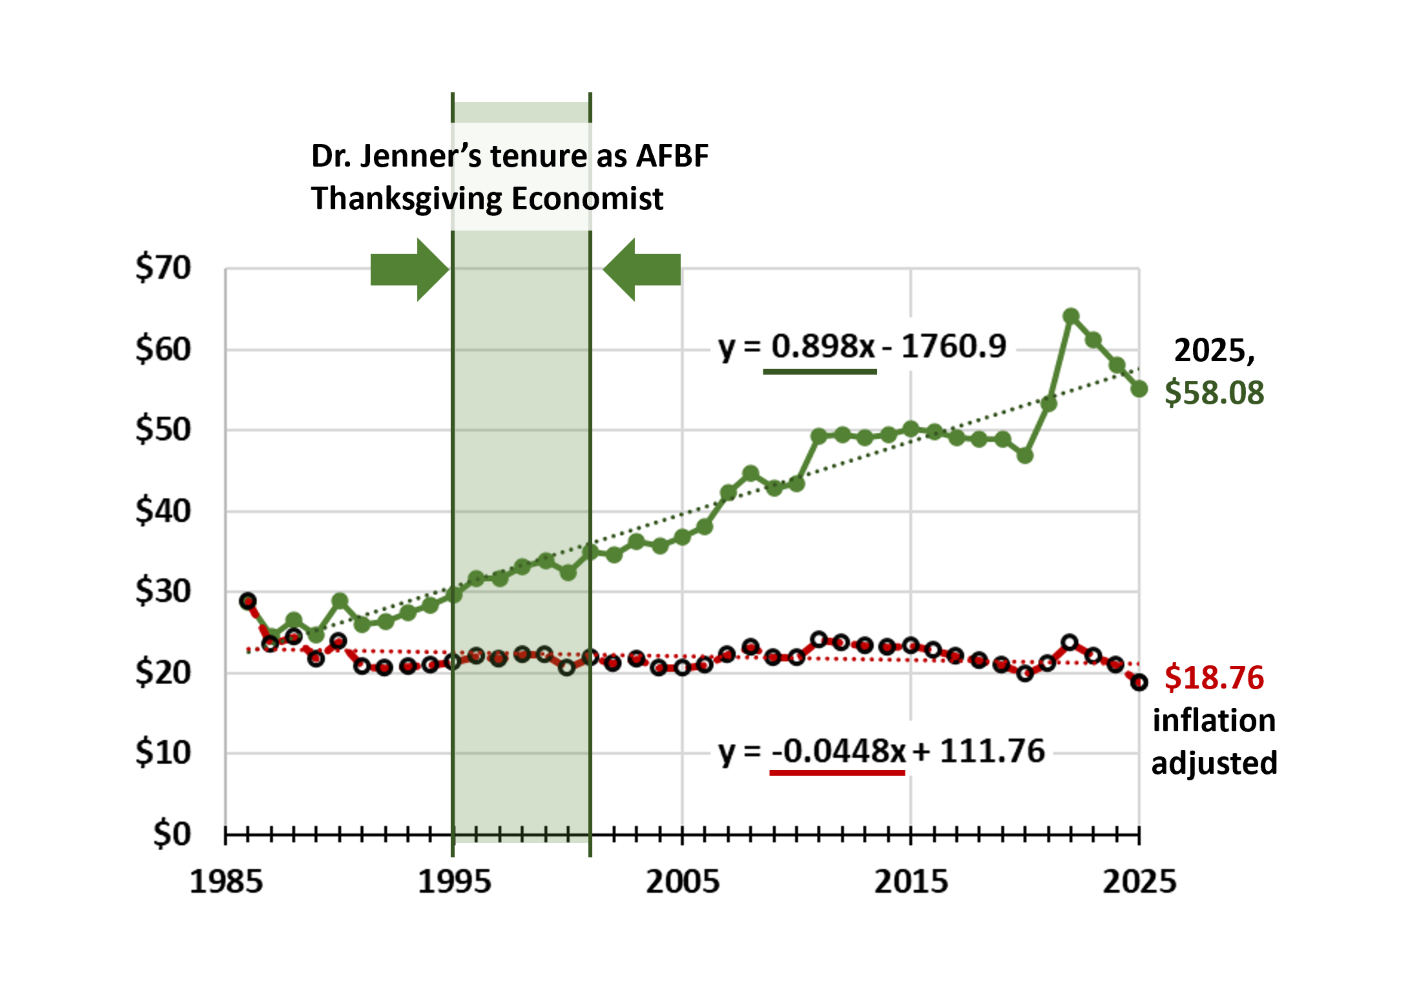
For 40 Years, Real Cost of Thanksgiving Meal Price Remains Constant
Serving as the American Farm Bureau Federation’s Thanksgiving economist in the 1990s was a pleasure. The cost of food thirty years ago was generally good news, so there was no downside. Unlike most of the more contested issues I worked … Continue reading →
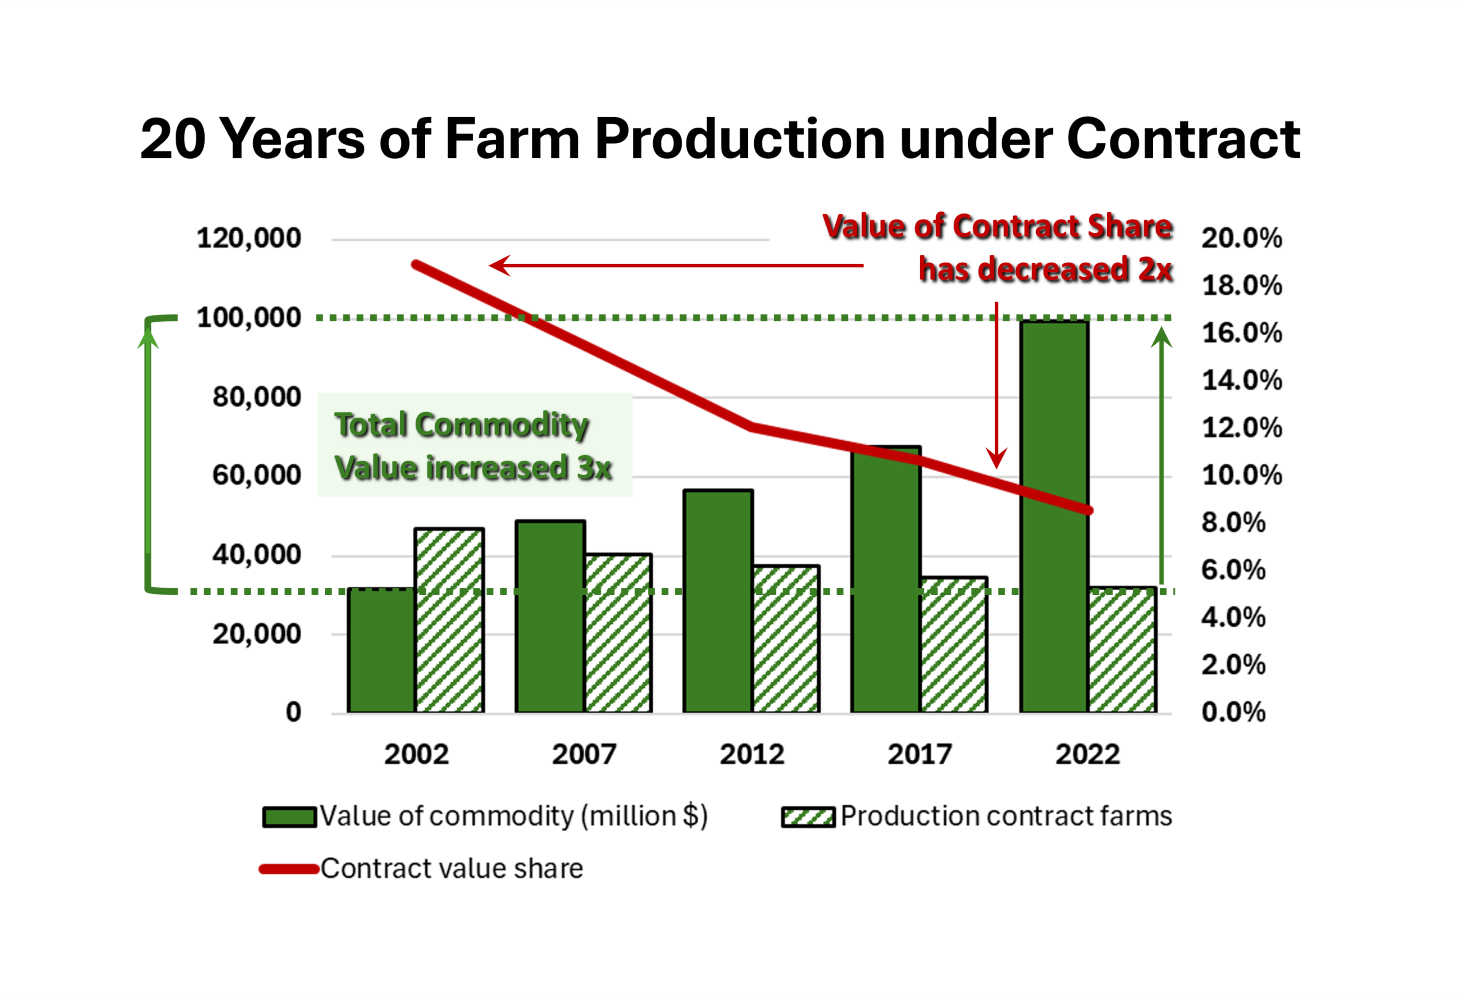
US Turkey Growers Do Not Receive Same Market Benefit as the Industry
Thanksgiving arrives with an annual focus on food prices. We host friends and family at home with lots of prepared food. One of the annual food price traditions is the American Farm Bureau Federation, Thanksgiving Survey. Regular readers know that … Continue reading →
St. Louis is a Hub of US Farm Production – St. Louis Agribusiness Club
In September, the St. Louis Agribusiness Club released their 2025 Economic Study of the agribusiness economic impact on the St. Louis region. For those of us in this region, it is validation of the passion we have for working in … Continue reading →
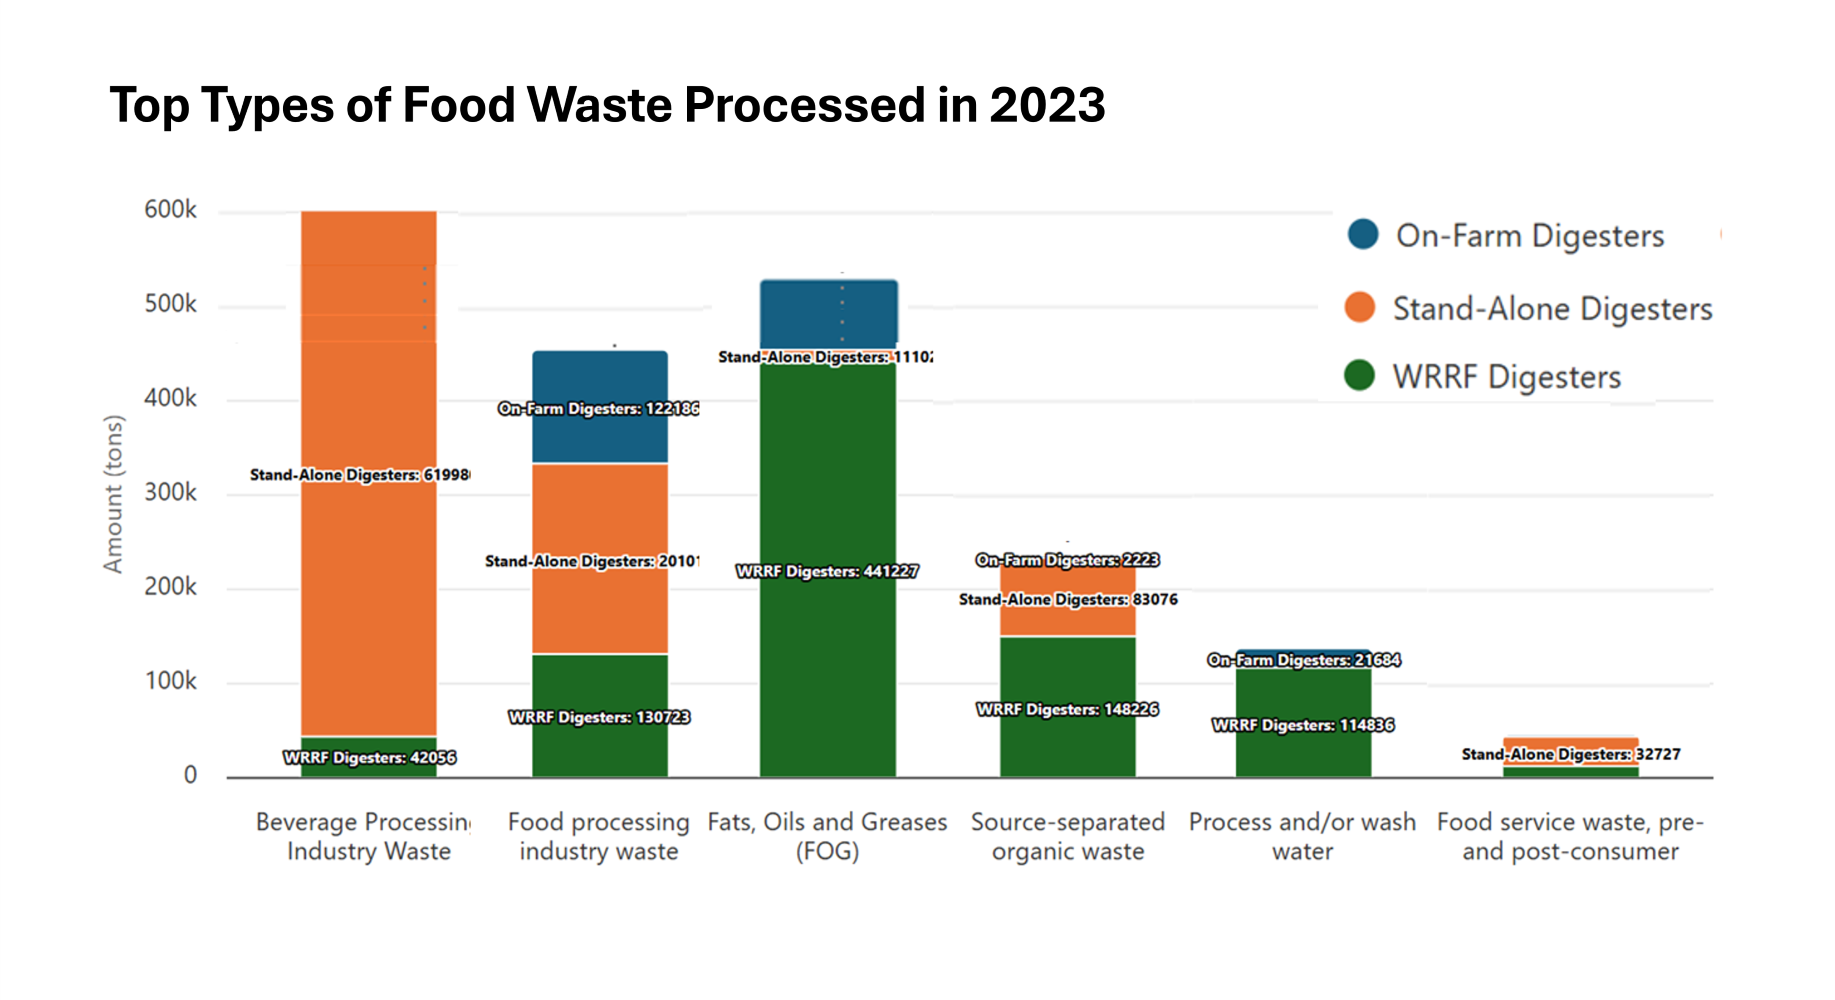
Anaerobic Digestion of Food Waste is Growing
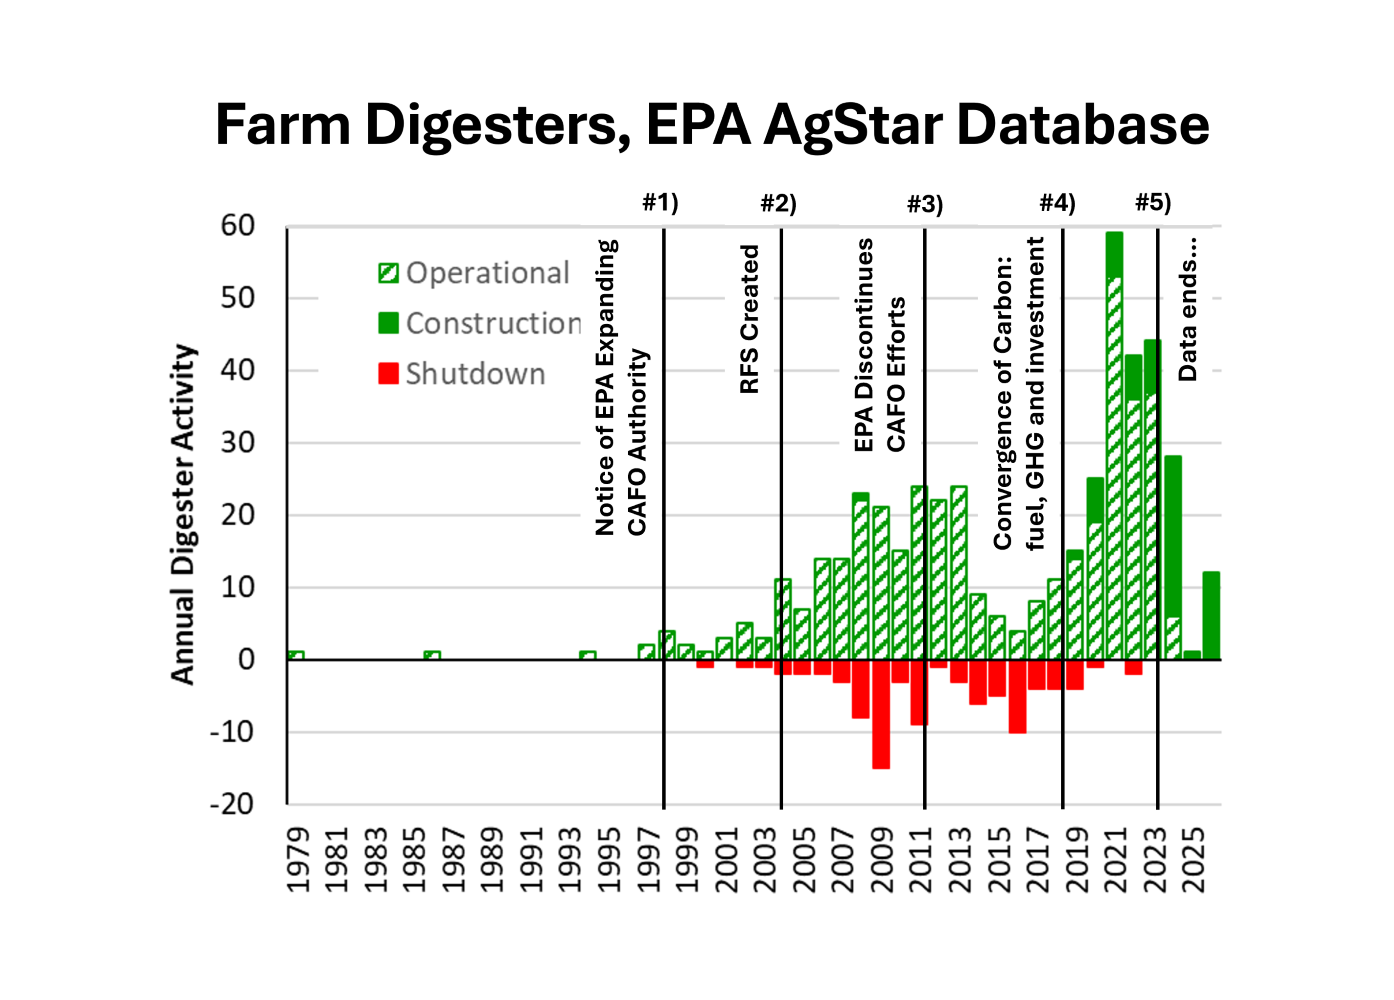
New market demand for renewable natural gas (RNG), or biogenic methane, is growing. First, the EPA AgStar historical farm digester data was charted to illustrate the rapid recent growth in farm digesters. Next, the EPA Landfill Methane Outreach Program (LMOP) … Continue reading →
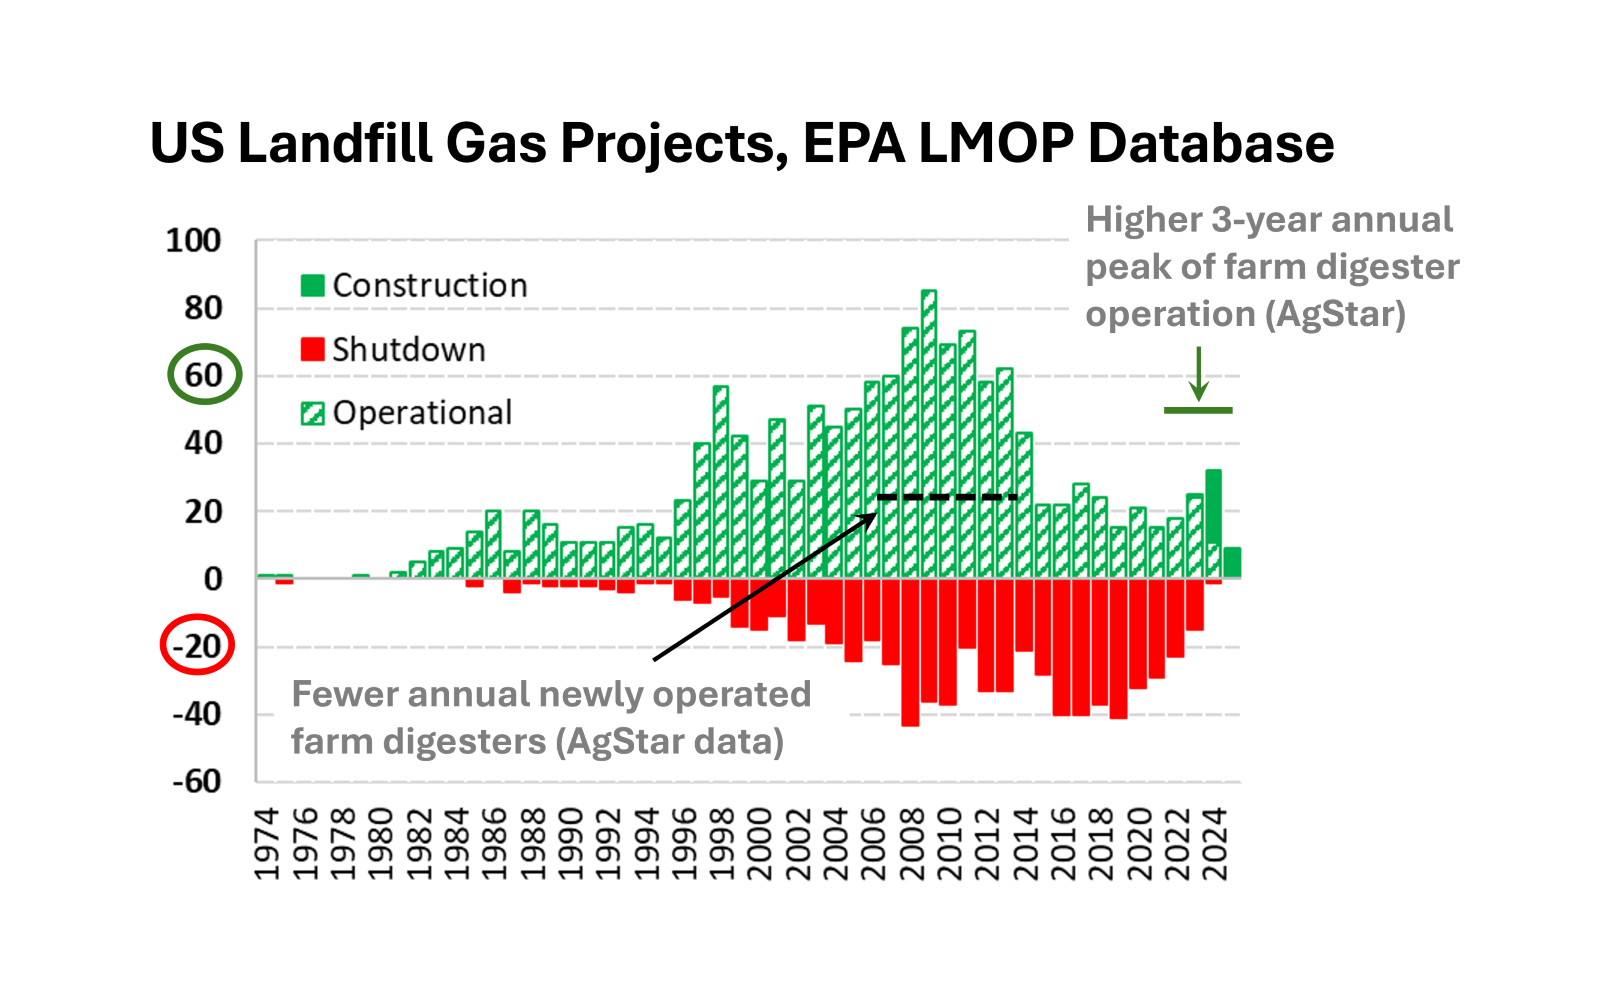
Historical Growth of Landfill Gas Projects in EPA LMOP Dataset
EPA’s Landfill Methane Outreach Program (LMOP) dataset is a foundation of the transformation of negative methane emissions into beneficial use of biogenic natural gas. This transition is robust, dynamic, and well documented. It has always been the older sibling to … Continue reading →
Farm Digesters are Busting Out All Over
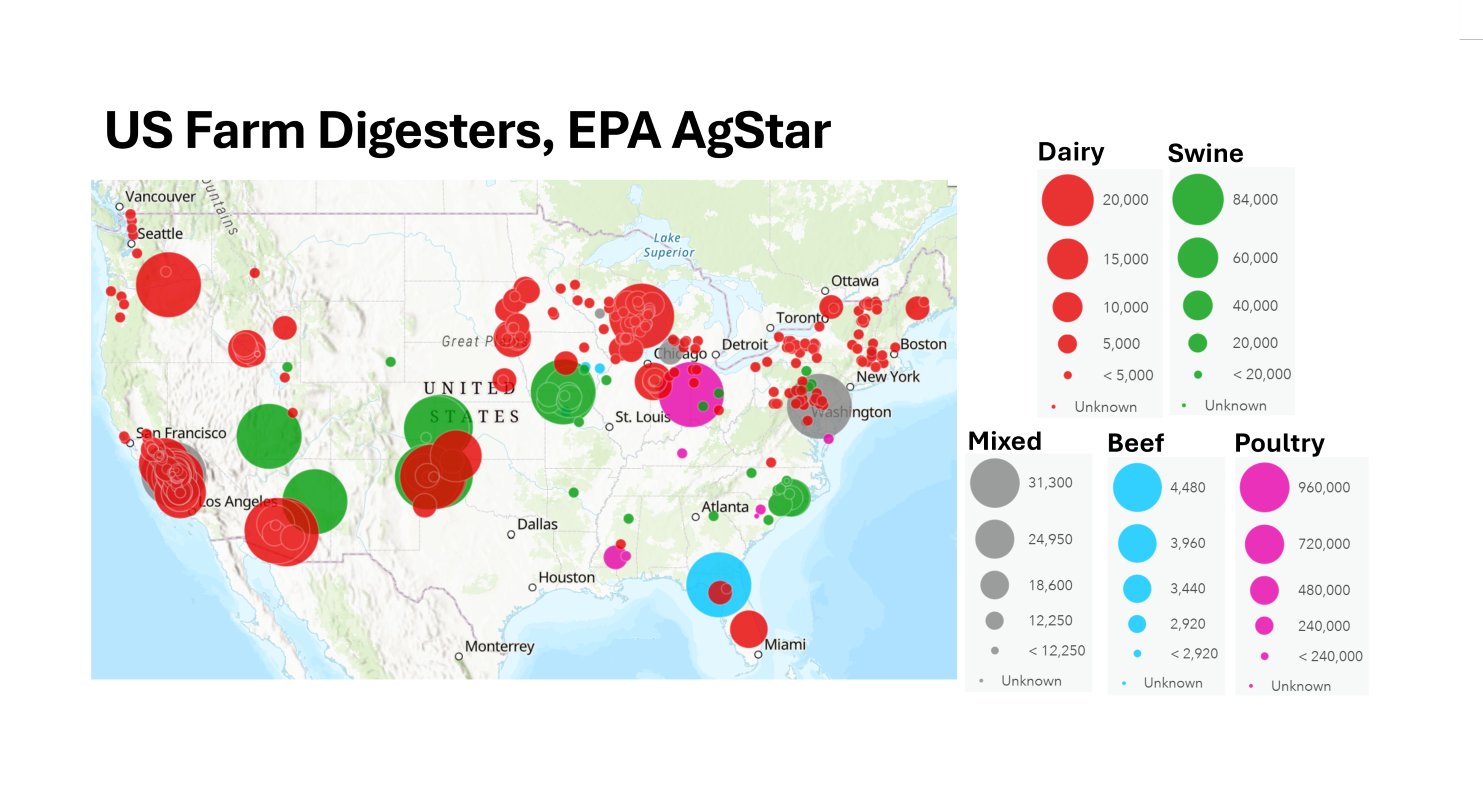
This fun map from EPA, AgStar farm digester website gives a striking visual of the distribution of US farm digesters. The largest digesters are fewer than ten years old. This dataset was last updated in 2024. At that time there … Continue reading →
Cultivating Fuel on Farms and the Growth of the US Farm Digester Industry
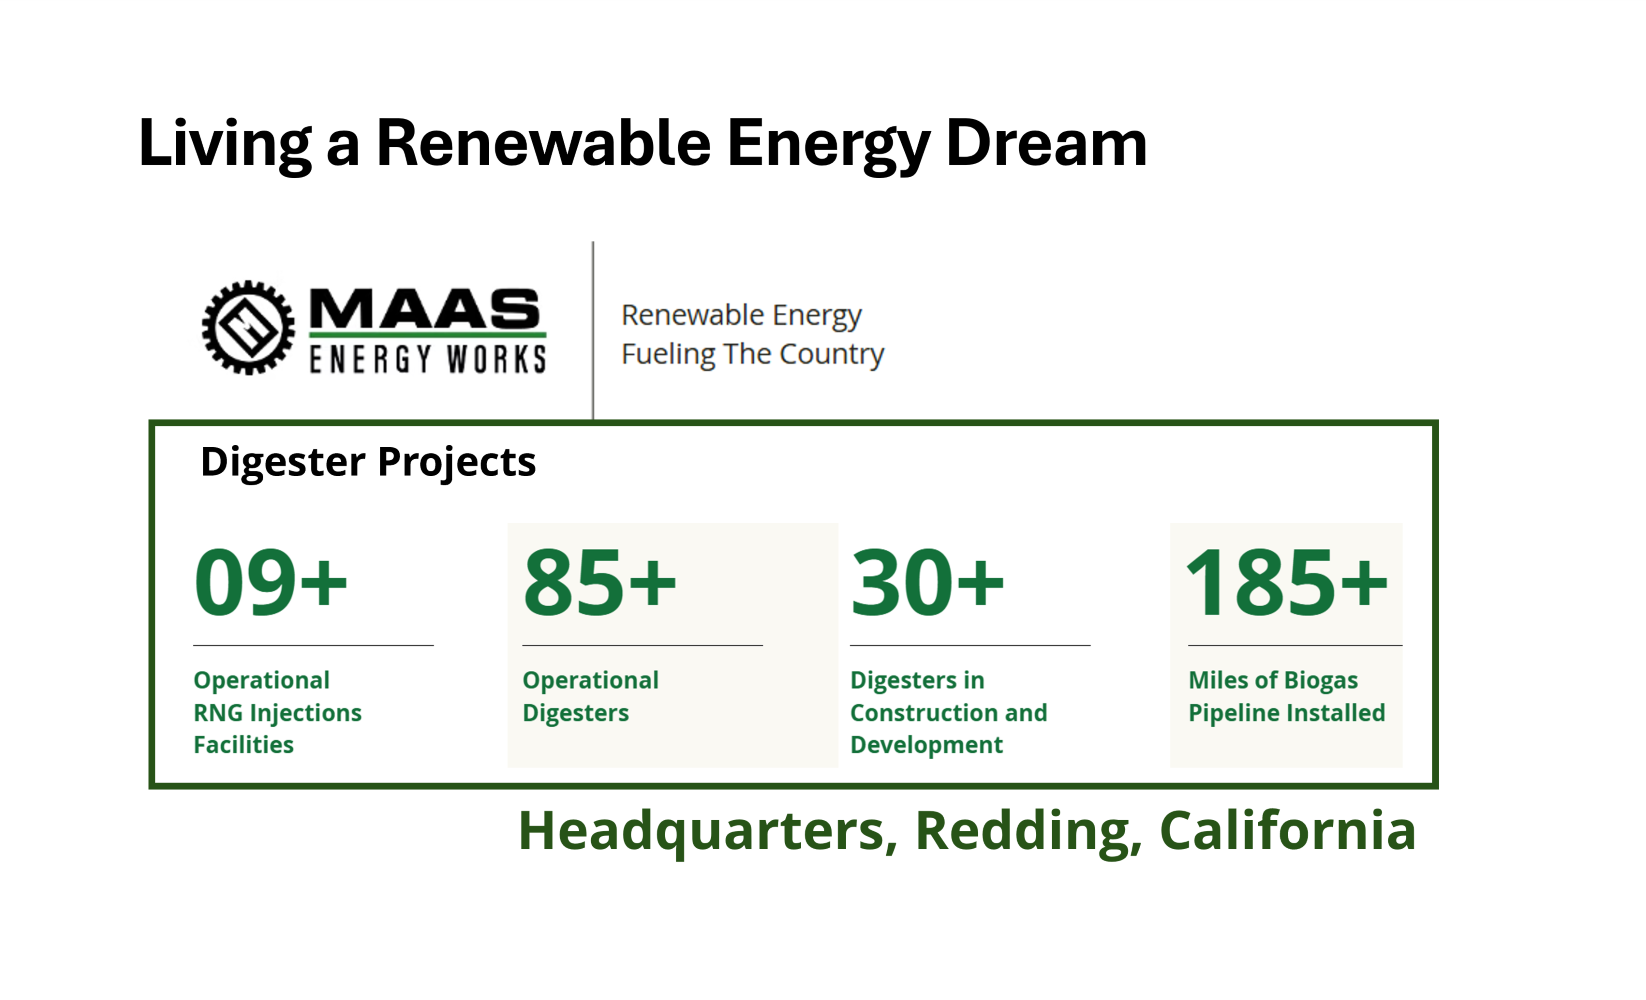
Revenue-generating renewable methane is real and a growing industry. My encounter with MAAS Energy Works at Simpson University in Redding, California earlier this month, was a homecoming for Biomass Rules. The importance of this topic was reenforced with the American … Continue reading →
Just a Kid in a ‘Biogenic Methane’ Candy Store
While at visiting Simpson University’s Operation Management’s class last week, I received a welcomed education! The day I was visiting Simpson University’s Business Department, so was MAAS Energy Works. Wow! Such a happy convergence. Twenty years ago, through Biomass Rules, … Continue reading →
Lessons of Living Shared with Simpson University Macroeconomic Students
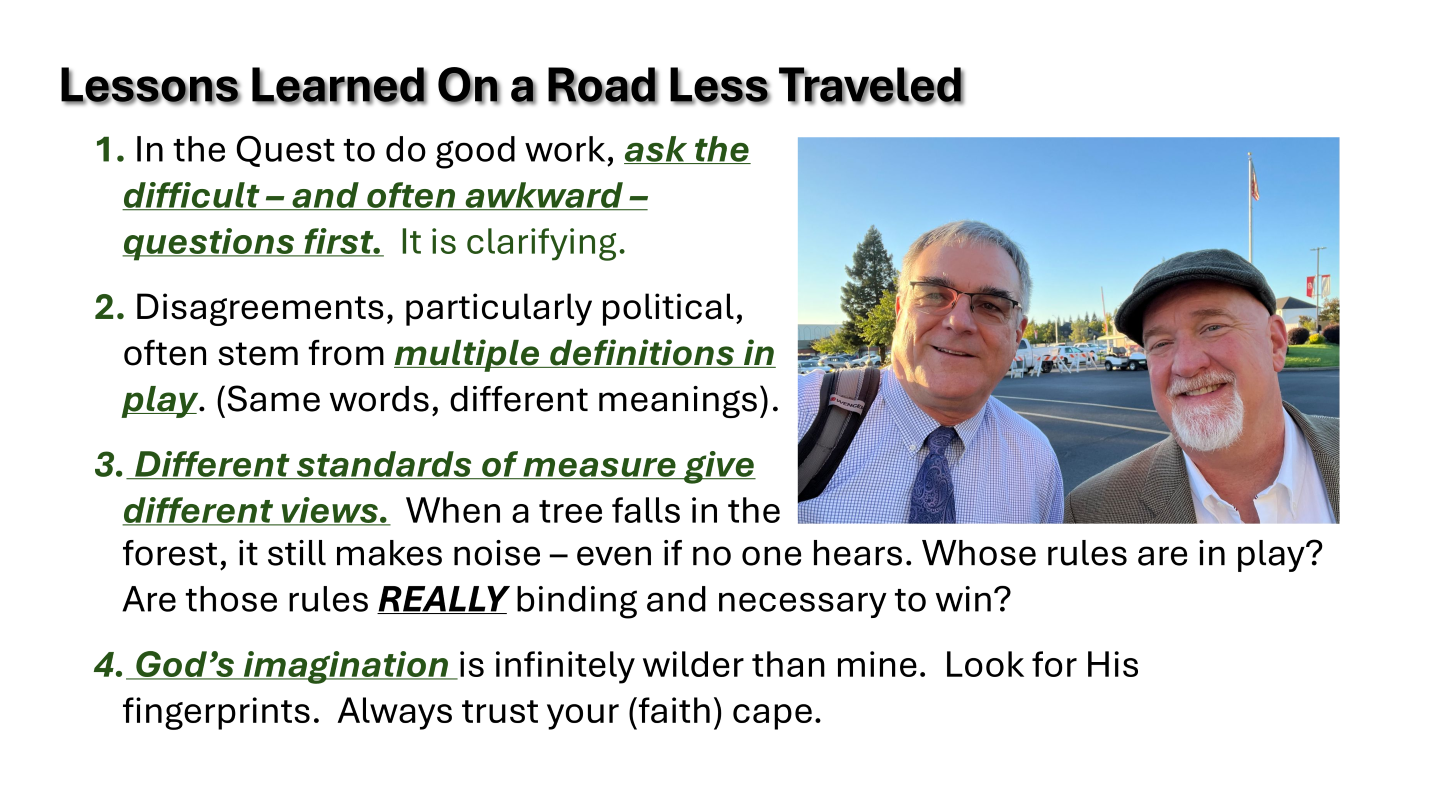
I really enjoyed spending a recent class period with macroeconomic students at Simpson University in Redding, California. Simpson is a private, faith-based college similar to Greenville University where I taught for eight years. One constant over my 45-year career, is … Continue reading →

