Home Solar Array Offsets Two-Thirds of 2024 Power Consumption-Making $ense of Energy
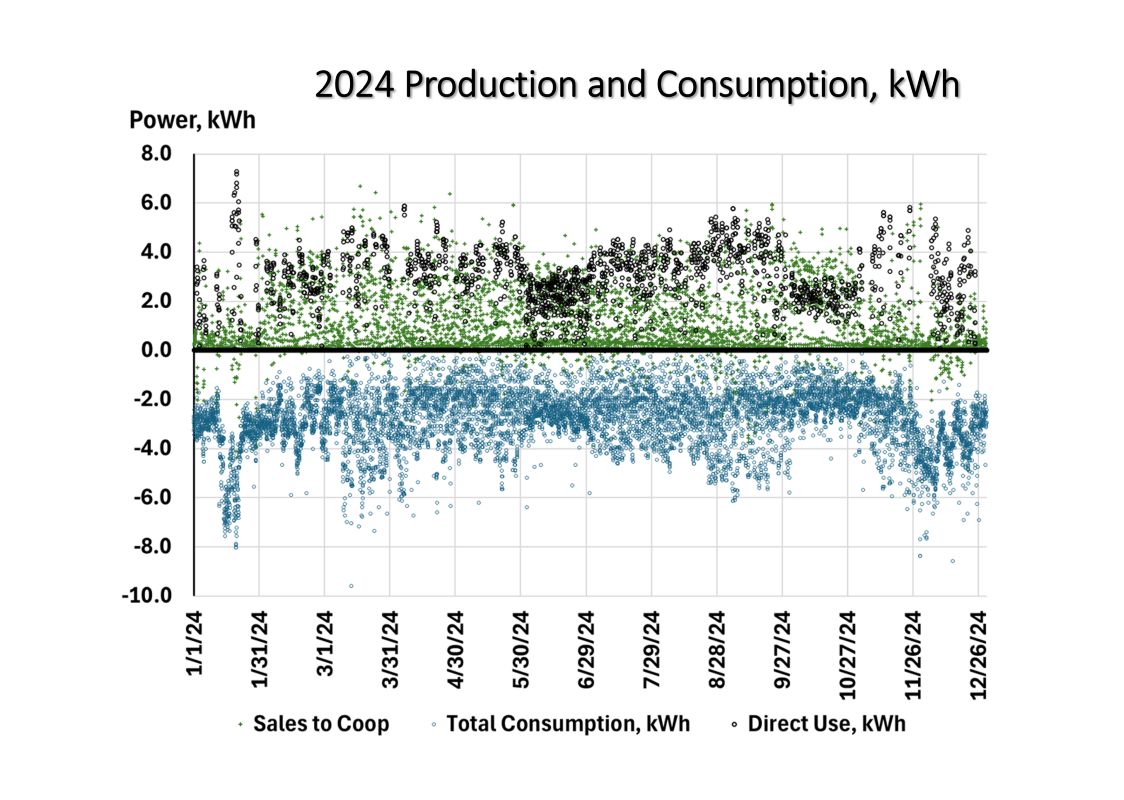
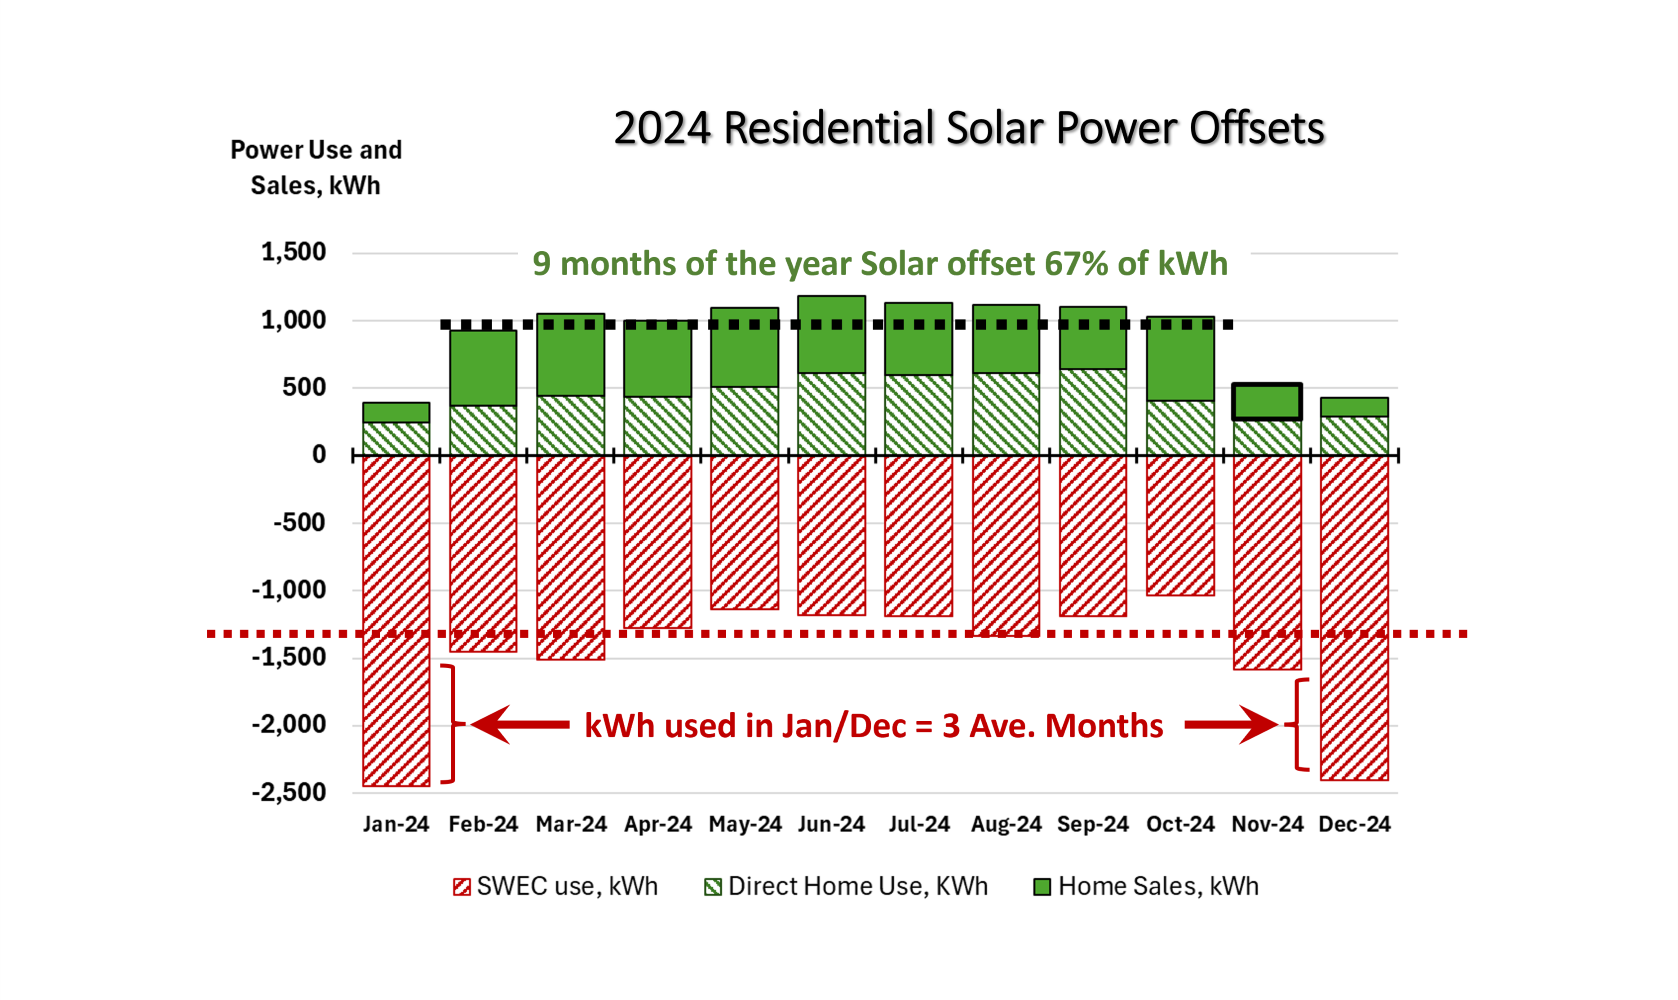
After all is said and done, this residential solar array in the non-winter months offset 67 percent of home power production. This chart is monthly solar production and household consumption in kilowatt hours (kWh). While it required both the solar … Continue reading →