

Comparative Monthly Solar Output – Making $ense of Energy
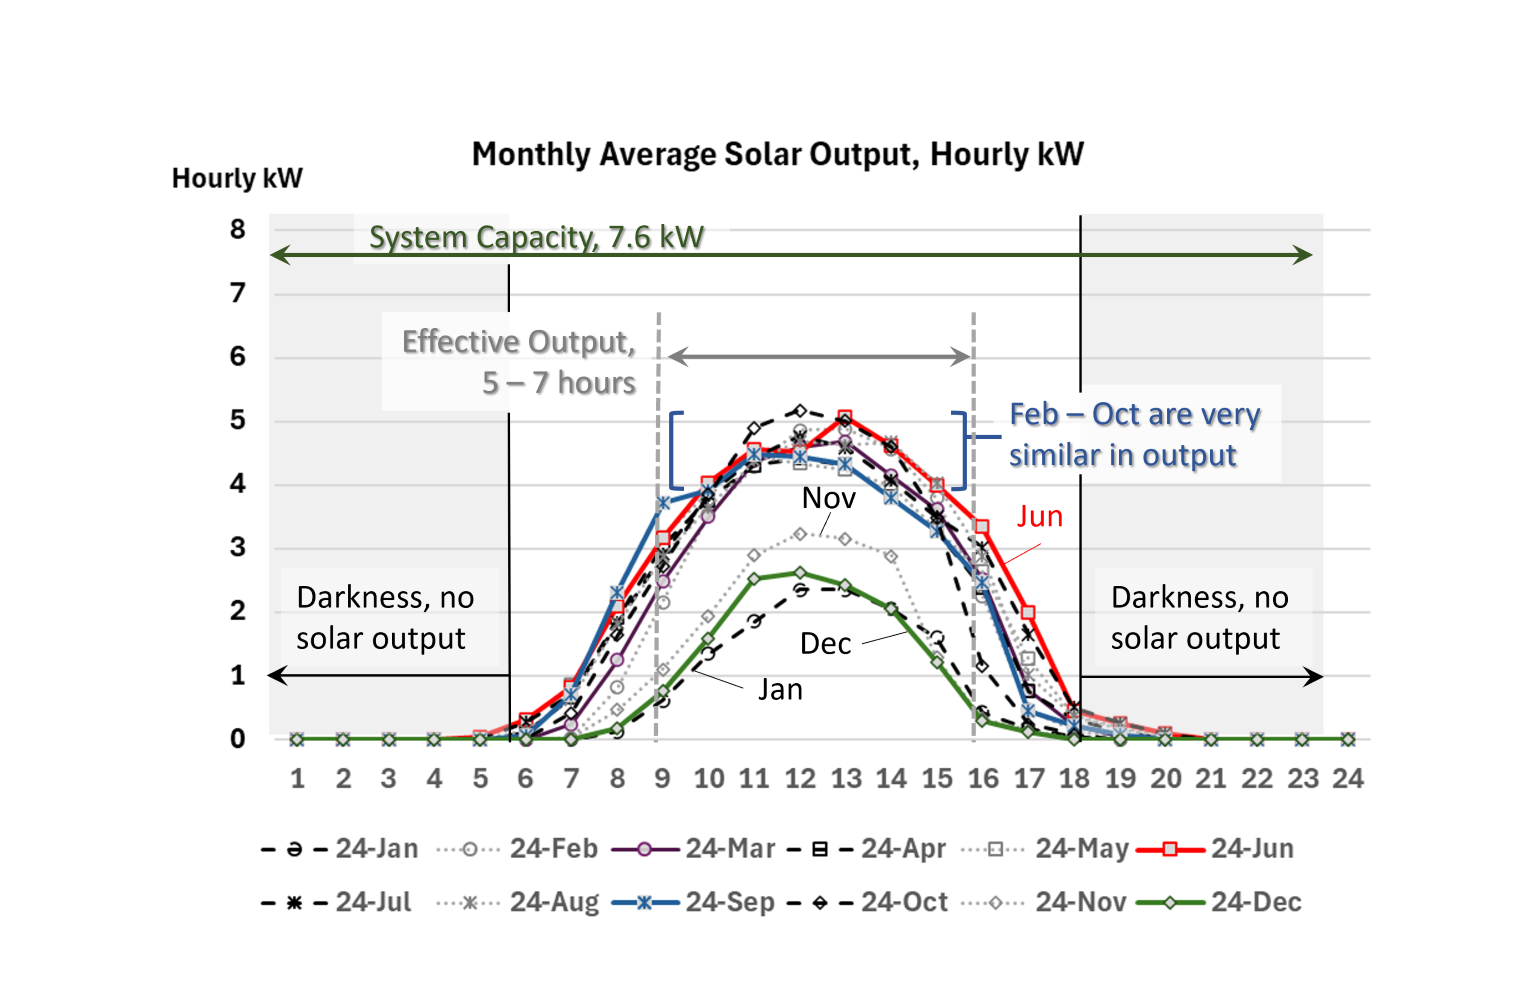
This post continues the deeper dive into power production of a residential solar array. The last post on solar output looked at daily variability of this solar array in June 2024. Variability from cloud cover in this geographic location, 45 miles east of St. Louis, Missouri, lowered effective output at about 70 percent of system peak capacity. This solar array has an installed capacity of 7.6 kilowatts. That same average daily output curve presented earlier for June is highlighted in this chart as a solid red line. Today’s post looks at variation between average monthly solar power output levels.
The winter months of November, December, and January, produce less solar electricity. This is intuitive with shorter days and less solar energy hitting the northern hemisphere during this time.
Interestingly, no similar increase is seen in the months when the most solar energy is hitting the northern hemisphere, May, June, July. In fact, October had the highest solar power production of all 12 months in 2024.
Just as the effective daily variation from cloudy days was surprisingly counter intuitive in the previous post, the effective monthly solar power variation has both intuitive and counter-intuitive components. The intuitive and less intuitive aspects of monthly variation of solar output are easily identified.
Cycles that make intuitive sense:
- The winter months produce the lowest solar power
- There is no solar production for 12 hours when the sun is not shining.
Cycles that are less intuitive:
- The solar array does not produce at capacity the entire time the sun is shining.
- In early morning and later afternoon, solar power is very low.
- Effective daily output is about 5 to 7 hours (25 percent of each 24-hour day).
- Monthly average output is about 70 percent of system capacity (cloudy days reduce output).
- Effective output at 70 percent capacity, for 25 percent of each day, is consistent for 9 months. This is the reliable consistent quantity of solar generated power that can be measured for residential power consumption.
This lesson in monthly variation was the initial starting point of these posts, but it became clear that the daily variation within each month proved too significant. Before the variation in power production between months could be addressed, daily variation must first be addressed (previous post). Now, after all the data settled, the quarterly solar inflection in December, March, June, and September, simply less significant. It also became clear that only the winter months had significantly diminished solar output.
Power production makes the most sense when comparing supply and demand of power. After introducing the constraints of solar production (power supply), subsequent posts will begin to look at power use (demand).
For the last four decades, residential power production economics have been determined by utility interfacing policies. The utilities bear all the risks, so these policies focus on mitigating utility risks. The result are policies that do not always appear intuitive.
Comments
Comparative Monthly Solar Output – Making $ense of Energy — No Comments
HTML tags allowed in your comment: <a href="" title=""> <abbr title=""> <acronym title=""> <b> <blockquote cite=""> <cite> <code> <del datetime=""> <em> <i> <q cite=""> <s> <strike> <strong>