

Annual and Daily Solar Production from a Residential Array – Making $ense of Energy
Biomass Rules has been collecting solar production data every 5 minutes for the last 30 months (40,000 sunlight datapoints per year). The most surprising discovery is the variability.
Solar output on any single day is highly variable. Most days, it is difficult to get peak solar output for the length that the sun is shining. On June 21, 2026, the longest day of the year, Greenville, Illinois received nearly 15 hours of daylight from sunrise to sunset.
Yet in both 2024 and 2025 on June 21, the solar array produced only 5.7 peak hours of solar production. [The solar array has a capacity of 7.6 kW. On the longest day in both 2024 and 2025, the array only generated 43 kWh. 43 kWh/7.6 kW = 5.7 hours]. That is what happened, but it is not intuitive.
- Our system for the last 2 years has produced 10,000 kWh of electricity. Working backwards from kWh, capacity (kW), and days in a year, that level of production averages 3.6 peak hours per day all year.
- So, not the estimated peak output of 4.5 hours.
- Certainly not the 15 hours of daylight we received on June 21.
A hard fast rule with solar energy is that zero photons are converted to power when the sun is not shining. On a day that has 8 hours of daylight, that is one third of the hours in a day have potential to produced power, or 33 percent of the day.
Last April (2025), Biomass Rules looked at the daily variability for the month of June 2024. Another third was reduced combining the early morning sunlight and later evening sunlight (5-6 hours out of the longest day, 15 hours). This ratio is similar no matter how long the day is. The other big surprise for me was the variability due to clouds, rain, and snow. If the sun is not hitting the panels, power isn’t happening.
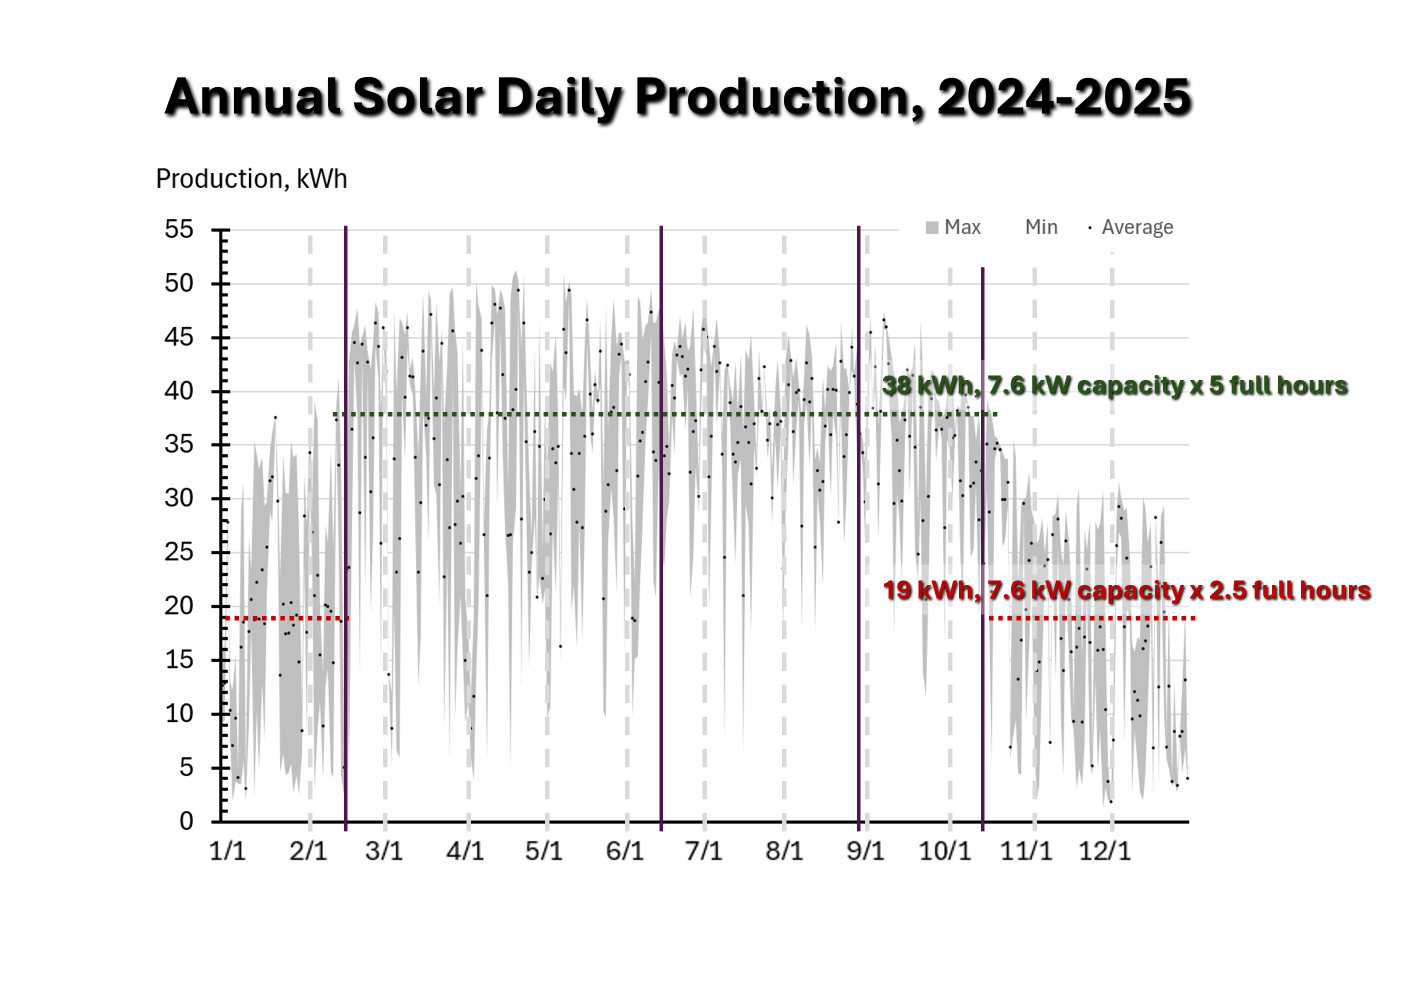
This post’s chart is a snapshot of daily variability over 2 years. That is 365 days (2024 was a leap year, 366). Often, the difference between minimum kWh output and maximum kWh output is that the minimum is 10 to 50 percent lower than the maximum. The small black dots in the chart are the average between the two levels for each day in those two years.
The solid vertical lines identify breaks in the production levels. The left and right most vertical lines indicate a visual break between winter and the rest of the year. The two inner vertical lines, June through August, indicate narrower bands of variability between the two years. These tend to be longer days with fewer rain showers.
The winter months, November, December and January, are much lower than the rest of the year. The rest of the year, kWh output averages more than 5 peak hours. But when the lower output during winter months are included, the annual average doesn’t even meet the predicted expected level of 4.5 hours per day (our average was 3.6 peak hours per day).
The installers forecast our system before it was installed predicted it would produce 10,000 kWh per year. They were right on the money. So, the good news is that the variability is understood well enough by the industry, that it is possible to develop estimates of solar output with confidence.
Two years’ worth of daily data is only a bit better than one year of daily data. It is possible that in the two years of data collected most of the range of variability (the extremes) has been captured. But without authentic historical data, the daily variation could not be visualized.
When the variability is well understood, risks can be managed. Solar power production is only part of supplying power to a residence. The utility power provider agreement is another layer of complication. It also is possible to manage, but successfully integrating solar power into our residential power consumption is highly dependent on operating within the boundaries of the utility’s rules. Managing the utility power use rules is another layer, in addition to operating within the window of solar power productivity.
The sun comes up every day. When the sun is shining, there is a good chance it will produce power from the solar array, but it is not a certainty. On some cloudy and rainy days, it may only produce 10 percent of the 33 percent of the hours in a day (3 percent of the sunshine in a 24-hour day). But in the first 2 years of solar production, the panels have been a good investment. They are insufficient to completely offset our daily power consumption, but as noted earlier, they are producing the 10,000 kWh as advertised.
Comments
Annual and Daily Solar Production from a Residential Array – Making $ense of Energy — No Comments
HTML tags allowed in your comment: <a href="" title=""> <abbr title=""> <acronym title=""> <b> <blockquote cite=""> <cite> <code> <del datetime=""> <em> <i> <q cite=""> <s> <strike> <strong>