Corn is More than Food – Real Adventures in Economics
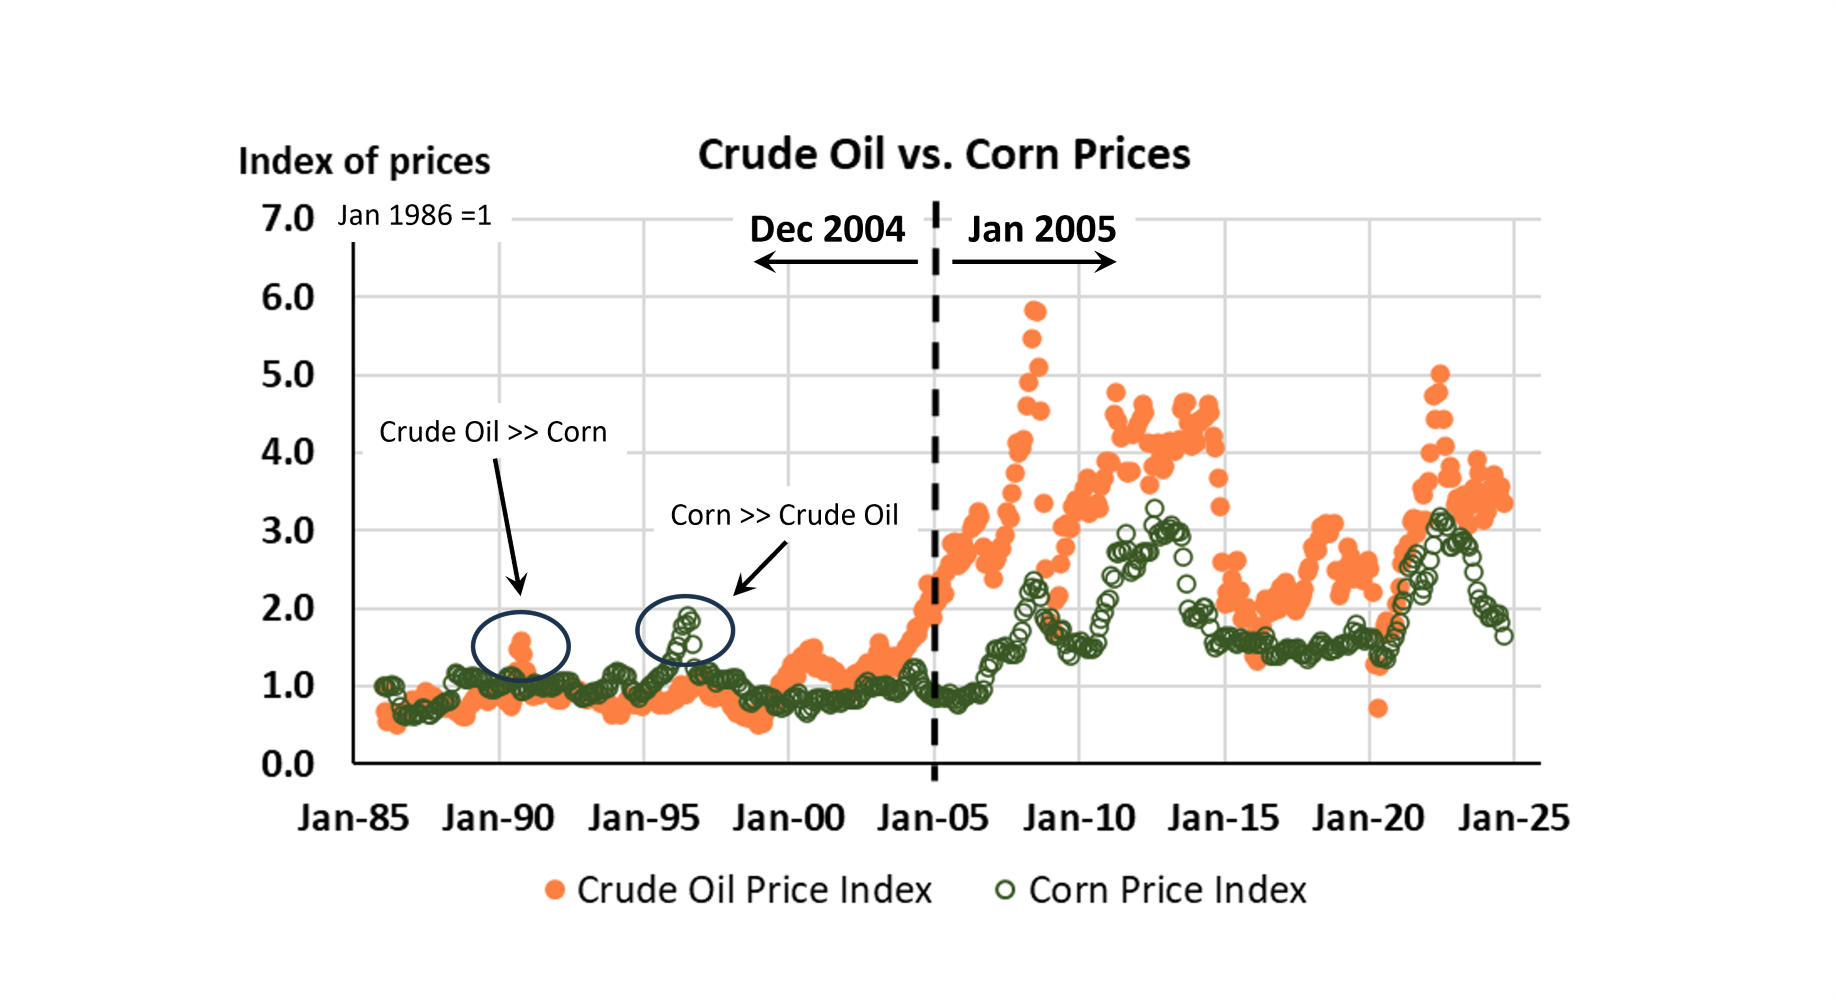
Number 2 Yellow Corn plays many roles these days. Among them both ‘sustainable savior,’ as well as, ‘destroyer of humanity and the planet.’ That is a pretty broad range. Back in the good old days, 20 years ago, corn was primarily as nutrient into livestock and human food. Today it is more. That change occurred around 2004 through 2006. The vertical line in today’s chart is at January 2005 for reference.
Crude oil is the primary feedstock for diesel fuel and gasoline. Corn is the primary feedstock into ethanol fuel. An excellent question is are crude oil prices and corn prices interdependent? The easy answer is yes and no.
Background: The big turn-of-the-century change is due to the production of biofuels from agricultural commodities like corn and soybeans. The economic underpinning of this shift is laid out in the March 27, 2024 blog post, Demand for Corn Stocks to Use – Real Adventures in Economics. This is an economic, more than a market performance evaluation. Replacing the fuel additive, MTBE, with ethanol 20 years ago 1) protected existing air quality performance provided by MTBE, and 2) improved water quality from fuel tank leaks containing MTBE.
The corn stocks post from March set the context for a documentable shift in demand elasticities for corn storage. But that works as a proxy for corn demand also. Corn storage became significantly more inelastic once corn moved into to the U.S. transportation fuel supply system. The Stocks to use data used from Kansas State University was annual data, so selecting a break between 2004 and 2005 was straight-forward.
Today vs. Olden Days (20 years ago): Our data time horizon was set by the Department of Energy, Energy Information Administration (EIA). Their crude oil price download begins in January 1986. USDA provides monthly corn price data back to 1908! (Corn in January 1908 was $0.55/bushel). The point is rather than selecting a specific date range the data providing system established the date range.
Also embedded in this simple illustration is the monthly data. Corn and crude oil are both traded all day every weekday. That is far more data than a monthly price. USDA weights the monthly prices with the daily price and quantity sold data. There is an established methodology from taking hours of daily transactions and formulating a value that represents the monthly price.
The data in the chart is not prices. The crude oil price and corn prices were indexed to the first price in the series. All the prices were divided by the January 1986 price in each series. This allows the incremental changes to be compared for each series and between series. Indices are relative measures (no units). The August price for crude oil is $76.68 per 42-gallon barrel of oil. The August price of corn is $3.86 per 56-pound bushel. Comparison of these absolute values (units) is challenging and has less meaning than using price indices.
Even without a PhD in ag economics, it is clear that corn and crude oil prices before December of 2004, were random. Sometimes crude oil had a much higher price than corn, and other times corn had a higher price than crude oil.
Prior to 2005 there is no interdependence between crude oil and corn prices. After 2004 though, these two prices move together. When Dr. Jenner’s career was mapped on the U.S. inflation rate, it was called spurious correlation (coincidence). There is more to the price index dance between corn and crude oil prices. But beyond that it is more complicated. Crop production relies on a lot of diesel fuel and fossil-fuel derived fertilizer. Ethanol composes 10 percent of the gasoline used in the United States. They are interdependent.
Complements or substitutes?: Ethanol was initially substituted for MTBE. Instantly the demand for ethanol as a fuel additive became a fraction of the fuel supply. In this relationship, ethanol and gasoline are complements. They move together. That policy-derived demand made the price of ethanol very high for a while. Once the ethanol industry grew to that capacity ethanol supplies influenced the price less. For a minute in 2006 and 2007 there were visions of ethanol replacing crude oil. In this case, ethanol becomes a substitute for gasoline. There were some difficult physics to overcome. Today about half of the U.S. corn produced goes into 10 percent of the gasoline supply. There are many other more difficult realities in the substitution of ethanol for gasoline. This is not the reality today.
Ethanol is still a complement to gasoline. Corn is also dependent on crude oil for diesel fuel and fertilizer. Corn prices are dependent on crude oil more than the other way around. When the price of crude oil goes down, the ethanol producer prices also go down.
The markets for crude oil and corn have independent drivers. The rhythm between the two commodity price indices is not perfect. Sometimes, like the 2022 invasion of Ukraine by Russia, the different drivers move together. Russia and Ukraine are both global leaders in grain and fuel production. When they went to war, both industries had supply shocks that had less to do with the food-fuel interdependence.
My Greenville University agribusiness students examined these food and fuel relationships. There is more to this adventure. But the point here is long-standing market relationships change. It is a lot of work to keep up, but the alternative is flying blind.
Pay attention!


Comments
Corn is More than Food – Real Adventures in Economics — No Comments
HTML tags allowed in your comment: <a href="" title=""> <abbr title=""> <acronym title=""> <b> <blockquote cite=""> <cite> <code> <del datetime=""> <em> <i> <q cite=""> <s> <strike> <strong>