

Demand for Corn Stocks to Use – Real Adventures in Economics
Most economic demand today manifests itself in report charts and news as a change over time. But traditional economic supply and demand curves do not have time in them (price x quantity). Demand drives any economy, but it doesn’t look like the economics textbooks in real life.
Except for this wonderful grain merchandizing relationship of corn price to the stocks to use ratio.
University of Illinois, Farmdocs economists, Scott Irwin and Darrel Good introduced this relationship to me within the last decade. But their 2016 article, The Relationship between Stocks-to-Use and Corn and Soybean Prices: An Alternative View, captures the beauty of the shift to ethanol production 20 years ago. The relative value of corn increased. Substitutes became scarce, and holding unsold corn, or stocks, became more costly.
Ending stocks are the grain that is left over at the end of the marketing year. ‘Use’ is consumption, which is not the same amount that is produced each crop year.
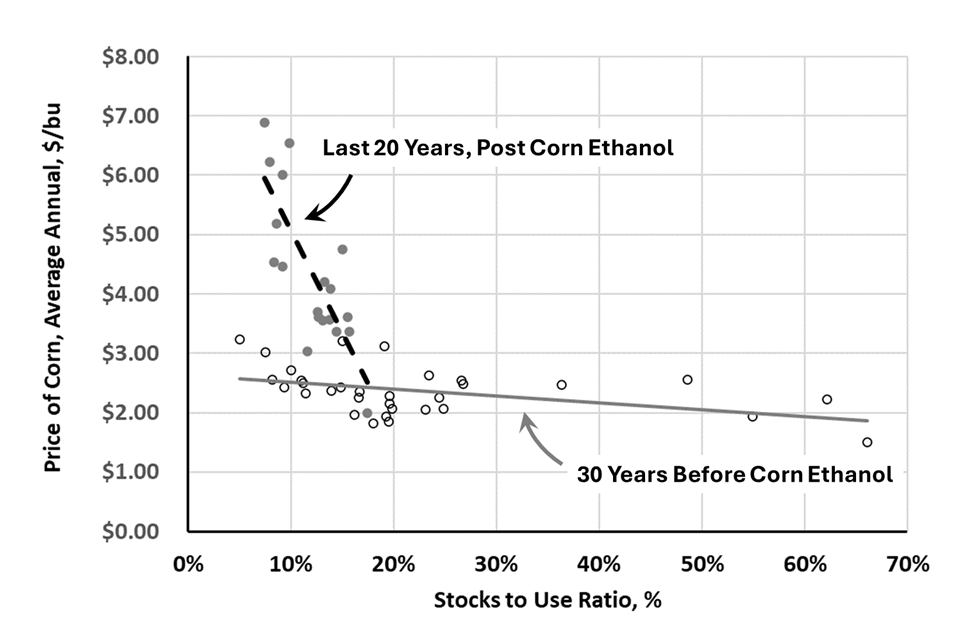
Before the ethanol industry expansion in the mid 2000’s, livestock feed was the primary use of number 2 yellow corn in the US. From 1973 to 2004, the open circle markers in the chart, there was a relationship between stocks to use and price, but it was not like it is today. The advent of the corn ethanol industry, among other things, changed that. I was consulting during that boom. It was an outrageous time. Money was flying. To infer that there was only one driver is ludicrous. I teach an agribusiness issues in economics class using Pat Westhoff’s, The Economics of Food: How Feeding and Fueling the Planet Affects Food Prices, 2010. It is an excellent chronology of the global impact of the U.S. shift of corn utilization.
Since 2005, through last year, the price of corn has become much more sensitive to the stocks to use ratio. Most recently, corn ethanol is the largest first use of US number 2 yellow corn. Livestock feed is still very high. And one third of each bushel of corn used for ethanol goes back into livestock feed as distillers grains once the ethanol has been removed.
While this chart is significant to the grain merchandizing industry, I am just an economics teacher searching for real-time economic phenomena. There are a few minor problems labeling this graphic relationship as ‘demand’. Quantity, here, is a ratio (relative, rather than absolute value). Plus, it isn’t really a demand for corn, it is more an indicator of corn inventory or, one minus the use. But the stocks to use trend, since 2005, is more inelastic. There are fewer substitute alternatives to the expanded demand for corn today than back in the old days – 20 years ago – before corn ethanol. The line created prior to 2005, or before corn ethanol is more elastic.
Thank you grain analysts for developing a relevant proxy for demand in the real world. Also Thanks to Kansas State University, AgManager.info, Grain Marketing, Grain Supply and Demand (WASDE), Llewelyn, spreadsheet downloaded, March 12, 2024. Downloading this rich data set was easy and rewarding.
Comments
Demand for Corn Stocks to Use – Real Adventures in Economics — No Comments
HTML tags allowed in your comment: <a href="" title=""> <abbr title=""> <acronym title=""> <b> <blockquote cite=""> <cite> <code> <del datetime=""> <em> <i> <q cite=""> <s> <strike> <strong>