Two Data Points Do Not a Trendline Make
Economic information these days, influenced by election-year passions, spawned economic claims that do not represent actual underlying economic trends. This post looks at the compelling nature of authentic data that does not have any meaningful forecasting value.
Biomass Rules is reconstructing and improving an earlier energy value reporting framework. In the bioeconomy, there is only one system for food, fuel, feed, and other markets driven by photosynthesis. We use different market structures for food, fuel, and livestock feed, but in each environment, hydrocarbons and carbohydrates have value as energy. Twenty years ago, Biomass Rules removed water and aligned the units of various fuels and put them all in $/MMBTU (dollars per million British Thermal Units). It is a construct created to look at how different markets value energy on a common unit. Natural gas is the only fuel that is often marketed in $/MMBTU.
The overhaul of the energy value data system is still under reconstruction. New technologies and new datasets are available and so the actual delivery is a few weeks off. But in the process of taking inventory of where we finished in 2011 and where prices are in 2024, there are ‘fun facts’ that merit sharing.
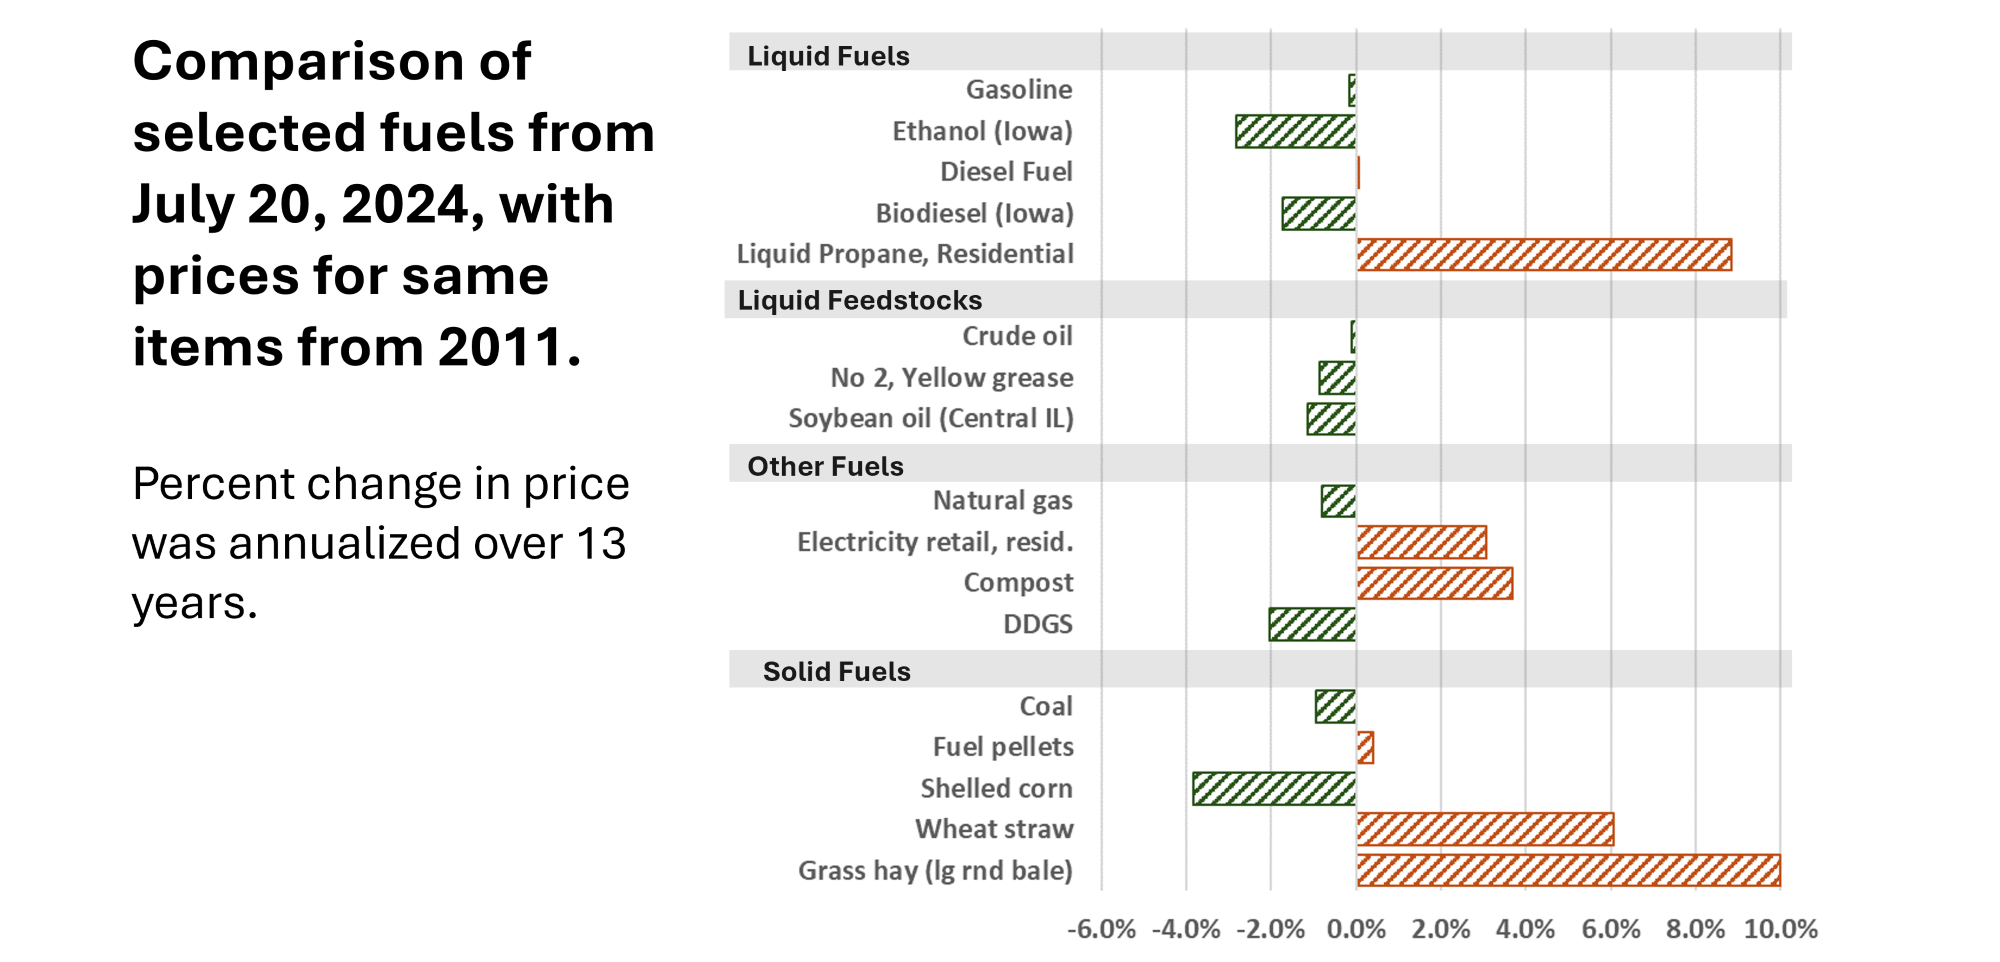
- Ten fuel items are lower in July 2024 than they were in August 2011: gasoline, ethanol, biodiesel, crude oil, number 2 yellow grease, soybean oil, natural gas, dried distillers grains (DDGS), coal, and number 2 yellow corn (shelled corn).
- Seven items have higher prices in 2024 than they did in 2011: diesel, liquid propane, residential electricity, compost, fuel pellets, wheat straw, and grass hay.
- Grass hay, liquid propane, and wheat straw increased between 6 and 10 percent on average annually over those 13 years. Grass hay went up 130 percent (more than doubled in those 13 years).
What does any of this have to do with increased inflation?
ALMOST NOTHING!
‘Almost’ is a relative nothing. Commodity producers and processors are subject to the same inflationary reality as the rest of the economy, but the prices of commodities have different rules.
Commodities are perfectly competitive. They are not branded, and competition is fierce to keep price low. Prices only increase when demand goes up, so commodity producers must constantly find ways to lower their costs to keep the costs below the sales price. Commodity prices are driven by supply and demand, not by an inflationary rapid growth of the money supply.
The United States and the world have just come through several years of high inflation (a 12-month average of 9 percent inflation in June 2022). During the 24 month period between May 2021 and April 2023, US inflation averaged 6.9 percent. And still 10 fuel items declined in value from 2011 to 2022. The 10 year average, with two years of elevated inflation was 2.8 percent. Inflation is important and it influences point-in-time price interpretations as illustrated in the last 50 years of Census of Agriculture published data.
In April of 2020, crude oil futures hit a selling price of -$37 per barrel. If you sold oil that day you had to pay the buyer $37 per barrel to take it. The war with Russia and Ukraine – both large suppliers of fuel and grain – sent global prices for grain and fossil fuel high. While this happened during rising inflation in our prices, it was a supply and demand issue, not a monetary supply issue. On other commodity price activities, the 2019-2020 trade wars interfered with global soybeans sales (influencing supply and demand).
For each individual fuel in this chart, there is likely a commodity-specific story that is different from the other fuel commodities. Beyond the compelling lack of inference related to these important commodities over 13 years, there is not much more to glean. The swings in corn and hay prices in this chart are likely due to very high and very low prices, relatively in 2011 and 2024.
Price changes are complex and require experts that understand each market for which they work. It is one of the layers that keep our economy stable. Too often – especially in this election year – when one economic indicator appears different than expected, bedlam often ensues. Nearly always, the reality underly the observed change is far more complicated than assessing a snapshot of the obvious.
All the data in this post is real data. It appears that some items have defied inflation, and they have. But because they are commodities, they have different rules on price fluctuations. There is much more occurring beyond the prices on these two dates. Two data points are not sufficient to indicate a trend, especially with commodity prices. Even so, there are many claims made about today’s economy that are based on less information (fewer than 2 points of data).


Comments
Two Data Points Do Not a Trendline Make — No Comments
HTML tags allowed in your comment: <a href="" title=""> <abbr title=""> <acronym title=""> <b> <blockquote cite=""> <cite> <code> <del datetime=""> <em> <i> <q cite=""> <s> <strike> <strong>