

Renewable Power Capacity Differs by State – Making $ense of Energy
On a total energy consumption basis, the United States hovers just above 10 percent that is sourced from renewable fuels; wind, solar, biomass, hydroelectric, and geothermal feedstocks. On a recent road trip, it was clear that the Midwest States were not simply business as usual, but there was visibly more local power generation going on than there used to be.
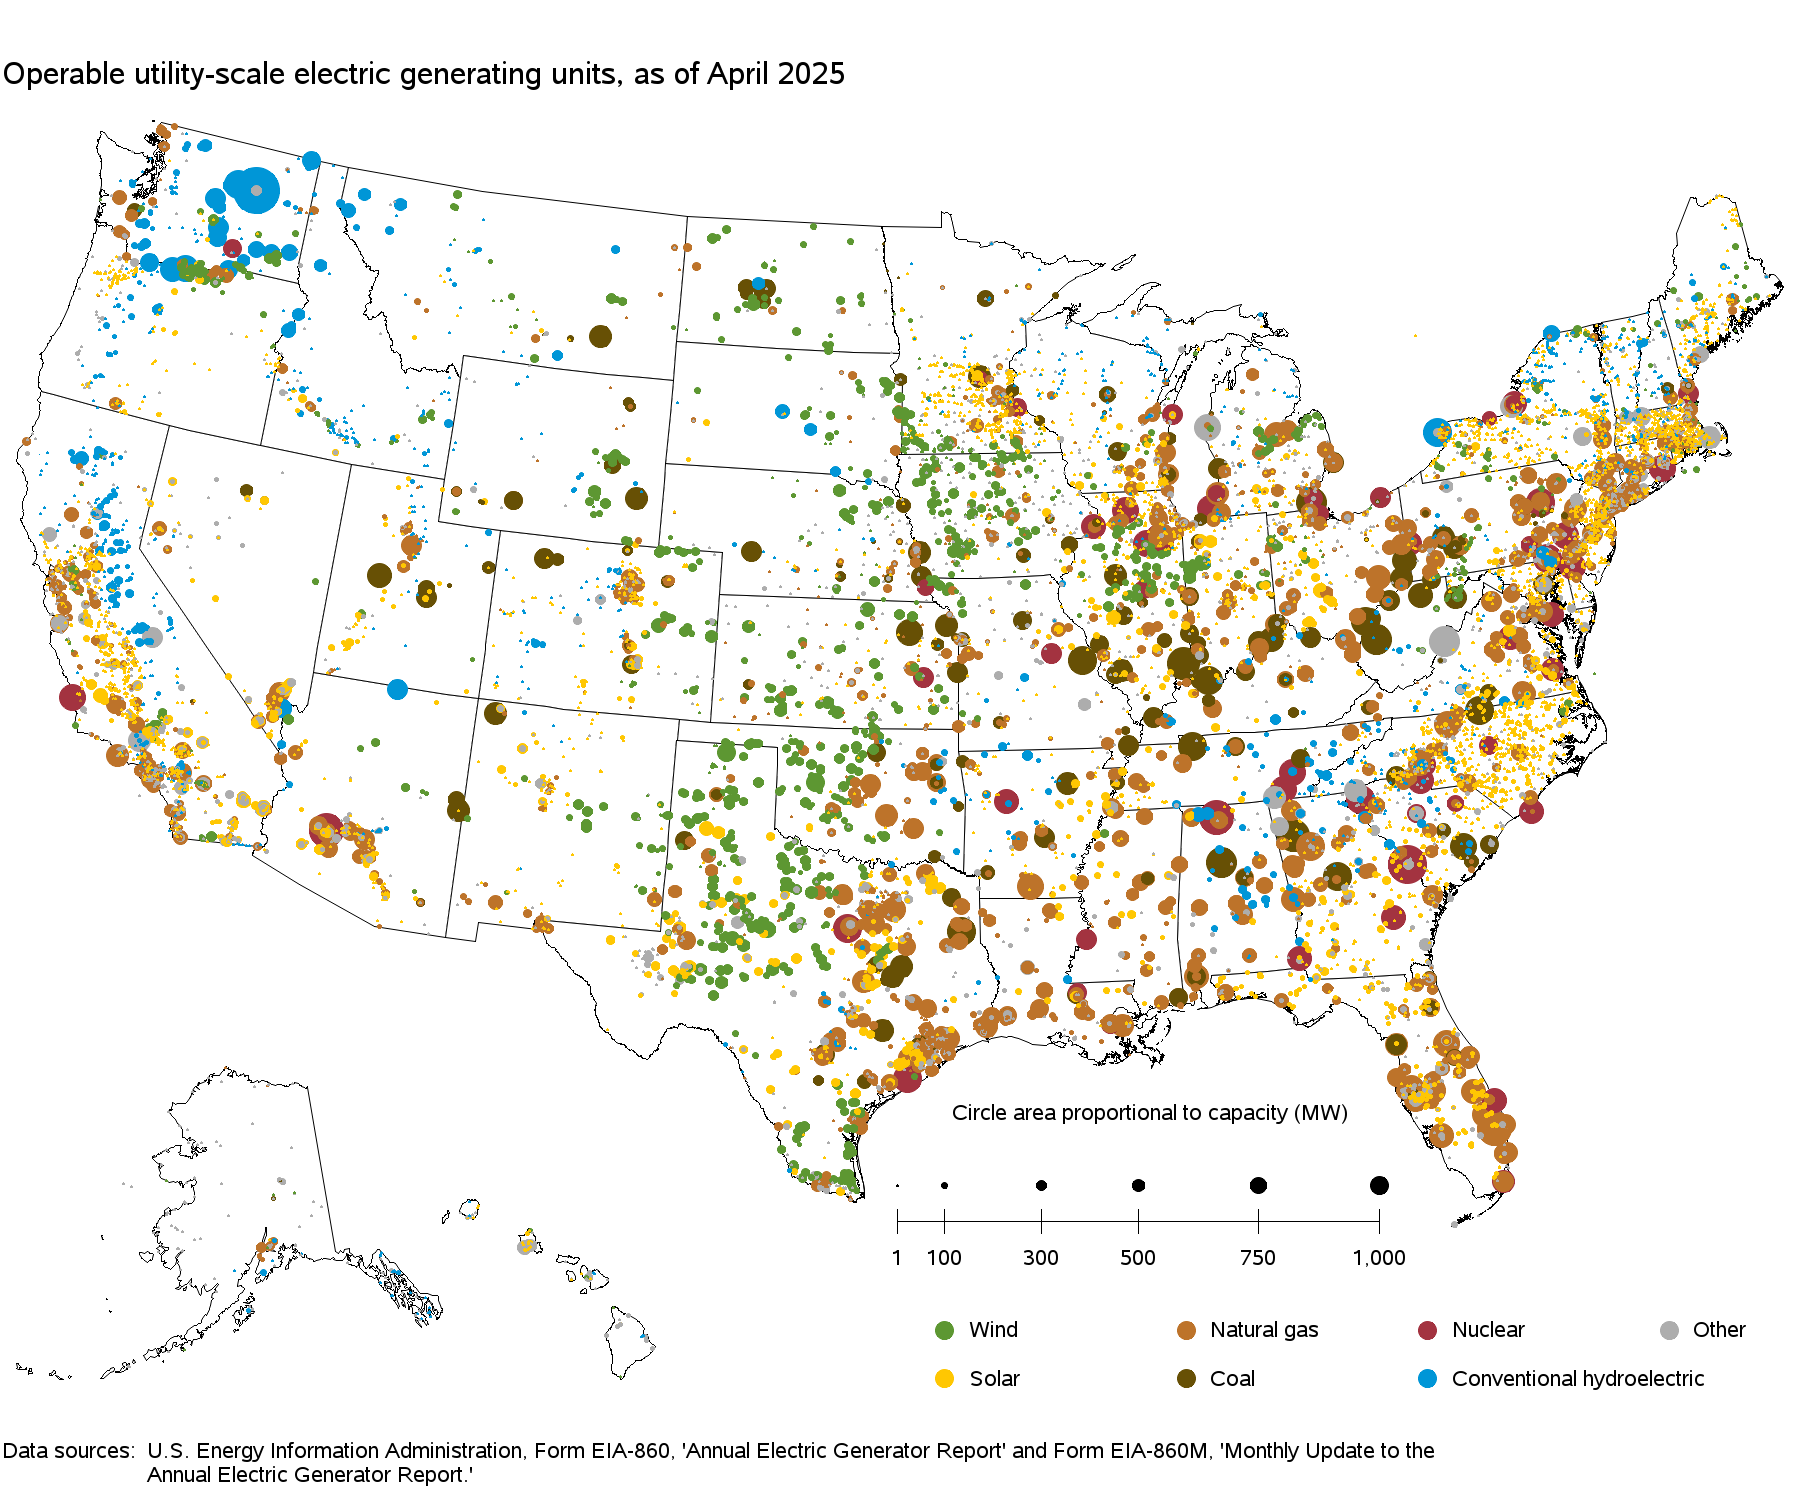
In the US, it is pretty easy to get great public data. The Department of Energy, Energy Information Administration (EIA) keeps track of US energy production and consumption. Much of it is accessible through state energy pages. This map is created from their electric generator inventory located at https://www.eia.gov/electricity/data/eia860m/ This link downloads 27,ooo facilities and is pretty serious. The information in this post came from Table 6.02A from the monthly updates to the electric generator inventory. It is a much more manageable format, but not a less effective visual than the EIA map.
The information on state renewable energy capacity can be summarized as follows:
- It is clear from the map that all states do not generate the same level of power. This opens up all unresolved local use and interstate trade questions for future posts.
- It also opens up questions about population density and per capita consumption. Weather (north vs. south) plays a role in generation of winter heating and summer cooling power needs.
- The average renewable energy summer generating capacity for the United States is 30 percent of total capacity. This is much more significant than a baseline of 10 percent.
- Half of the states (25), when ranked on percent of renewable generation capacity, produce less than 25 percent of electricity from renewable sources. States do not represent a homogeneous, uniform measure. The 25 states in the lower half of renewable power capacity account for 45 percent of the total US generation capacity (less than half of generation capacity).
- The average renewable energy generation capacity for these, 25, lower renewable energy capacity states is 16 percent.
- In the other 25 states – with more than 25 percent renewable generation capacity – total power generation capacity is 55 percent of US power capacity. This 25 states with higher renewable power capacity average as a group 42 percent renewable power capacity.
- Four states account for more than 75 percent of their power generation from renewable sources: Vermont, Washington, Idaho, and Oregon. Another 6 states have between 50 and 75 percent of their generation capacity from renewable sources: South Dakota, Montana, Iowa, Maine, New Mexico, and North Dakota. Some of these are notably small power generating and consuming states, but not all.
- There are 15 states that rely on between 25 and 49 percent renewable generation capacity. These include the largest power consuming states of Texas (39 percent renewable capacity) and California (43 percent renewable capacity).
Local Production and Local Use: The Pacific Northwest has significant hydroelectric resources. The arid Southwest has significant solar resources. The plains and the upper Midwest have significant wind resources. Developing these local resources is as intuitive as growing agricultural crops in the states with the best growing conditions. And while electricity can move across distances, it works best to haul the fuel across the country than it does to send electrons across the country. Therefore, in the areas where local wind, solar, geothermal, and hydraulic fuels are plentiful, it makes the most sense to utilize them locally.
Green Plants Produce Regenerating Solar Collectors, or Leaves: While plants are most valued in the markets for their carbohydrates: sugars, starches, lignin, and wood; as well as fats and oils. Electricity is not primarily the first use of these plant products, but the leaves, or renewable solar reflectors, are capturing solar energy mostly for biological energy production. As more individuals take up walking and cycling as modes of transportation, biological carbohydrate energy from the sun that is powering these activities. It is a small, but noteworthy offset of more traditional sources of energy.
There are legitimate challenges with locally distributed energy that differ from traditional centrally distributed power. But in areas where local production and local use are intuitive, arguments that focus only on broadly defined challenges are less compelling. Investment in new renewable infrastructure in areas where it is low-hanging fruit, is not the same as investing in these renewable resources where they are not plentiful.
Positions against renewable energy that paint these resources as unproductive as those positions that passionately promote renewable energy as an only choice. Too much of anything is a bad idea. We need to be intentional about our energy development investments. Any given state has different resources available than most of the other states. The profiles should look different. It is evident through current state-level renewable power generation capacity that states with abundant local resources are providing increasing self-reliance in those local areas.
Comments
Renewable Power Capacity Differs by State – Making $ense of Energy — No Comments
HTML tags allowed in your comment: <a href="" title=""> <abbr title=""> <acronym title=""> <b> <blockquote cite=""> <cite> <code> <del datetime=""> <em> <i> <q cite=""> <s> <strike> <strong>