

2022 Census of Agriculture Farm Typology Volume 2 Has Arrived
The USDA released the initial 2022 Census of Agriculture files in February 2024. We had to wait 18 months to get the farm typology data released in August of 2025. It is the same data, but it is organized by the Gross Cash Farm Income (GCFI) of family farms and non-family farms. GCFI includes the farm producer’s sales of crops and livestock, fees for delivering commodities under production contracts, government payments, and farm-related income.
The category, fees for delivering commodities under production contracts, adds some complexity. Using the values in Table 42, Commodities Raised and Delivered Under Production Contracts, the value of production contracts is roughly 9 percent of the value of those commodities. That is an average across species groups and will vary – more or less – depending on the species. This means that the value of production that is part of this chart for commodities under production contract was $99.5 billion in 2022. But the GCFI portion of payment farmers received was only $8.6 billion dollars in 2022.
The last component of the GCFI, farm-related income, also merits some explanation. This category of farm revenue includes custom work; rent received by asset owners; sales of Christmas trees, woody biomass and maple products; agritourism; dividends from cooperatives; state and local government payments; and anything else not considered as a farm product sale. This means that a farm that harvests 800 acres of their own crops and 200 of their neighbor’s crops would have the revenue from harvesting the neighbor’s crops show up in farm-related income. To the farm, it may simply be revenue. But in the Census of Agriculture the above categories of less-direct revenue are tabulated as farm-related income. This is less important in this post but will come up later in posts about farm-related income. Because this revenue is included in the GCFI, it gets treated here just like farm income.
This looks very similar to data presented earlier in, Modeling Farm Income versus Farm Household Income, in December, 2024. This data came from the USDA National Ag Statistics Service (NASS), Agricultural Resource Management Survey (ARMS). The ARMS data includes a few more types of farms (retirement and off-farm). USDA leverages all its data to deliver the richest (most detailed) picture of production agriculture while protecting farmer confidentiality. The ARMS data targets specific states with detailed queries. The Census asks each farm in the dataset to answer the exact same questions. So the different datasets have different purposes and results reflect the nature of the dataset.
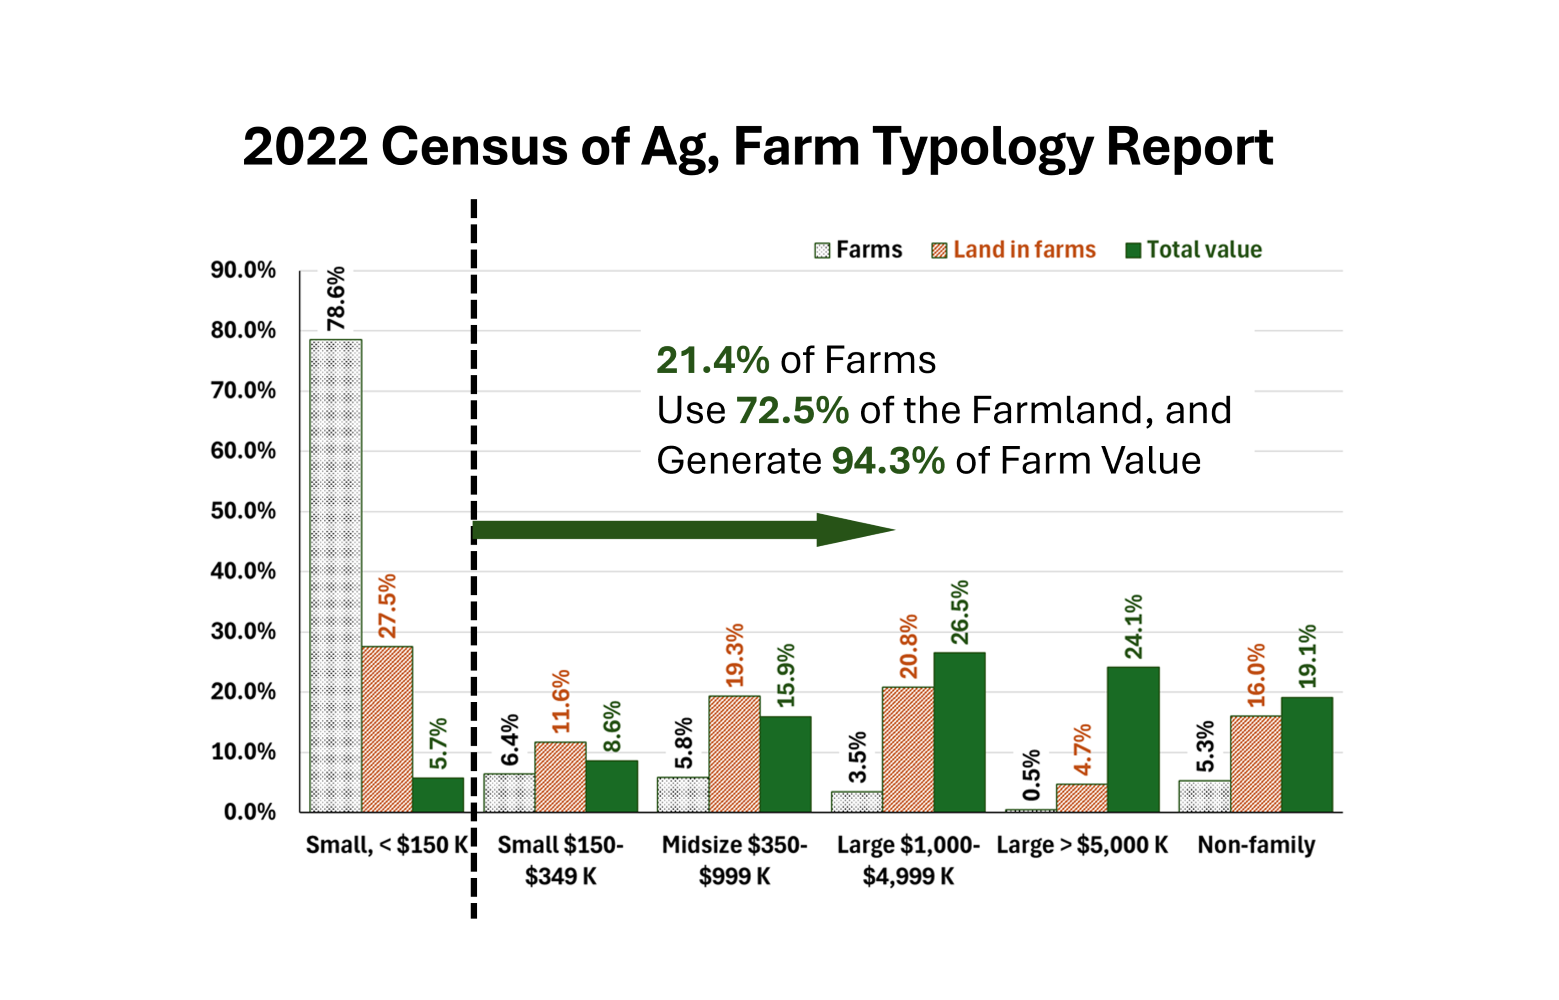
Today’s post marks the beginning of unpacking the 2022 Farm Typology data in the Census of Agriculture. Mostly today’s chart is intended to remind readers that the smallest 80 percent of US farms account for nearly 28 percent of the land and produce 6 percent of the value of farm production. Or as presented another way, 20 percent of the US farms use nearly three-quarters of the land to produce 94 percent of the 2022 US farm value of production.
This is not a judgement of large verses small. Every US farm plays a vital role. This will become evident as we work through the Census of Ag, Typology Report. And yes, in 2025, the US farm production industry is in a much different place than it was in the 2022 calendar year. But until last month, the most recent Census of Agriculture farm typology data available was from 2017. So the 2022 data is a welcomed improvement.
The 2022, Census of Agriculture, Farm Typology, Volume 2, is a treasure trove of data. We begin our journey with this post. Each farm typology plays a role. Our quest is to discover those roles.
Comments
2022 Census of Agriculture Farm Typology Volume 2 Has Arrived — No Comments
HTML tags allowed in your comment: <a href="" title=""> <abbr title=""> <acronym title=""> <b> <blockquote cite=""> <cite> <code> <del datetime=""> <em> <i> <q cite=""> <s> <strike> <strong>