A Case of Pricing Wheat from Farm to Food
Food pricing has many layers. Earlier, it was established that Biomass Rules considers food to be retail consumption of human nutrients. There are exceptions, but this working definition simplifies many parts. It is easy to look at the farm gate price of wheat and compare it to other products along the processor, grocery retail, and restaurant retail prices. To represent these supply chain stages, we can look at wheat grain, wheat flour, a loaf of bread, and IHOP pancakes, respectively.
| Price | per unit | $/lb | |
| Wheat grain | $4.87 | /60-lb bu. | $0.081 |
| Branded wheat flour | $3.49 | /2-lb bag | $1.75 |
| Loaf of bread | $3.64 | /20-oz loaf | $2.91 |
| 3 pancakes (IHOP) | $8.29 | /3, 60-g pan. | $20.91 |
The first problem is each item is sold in a different unit: 60-pound bushels (bu.), 2-pound (lb.) bags, 20-ounce (oz.) loaves, and three, 60 gram (g.) pancakes. While this is another simplifying intervention, it is reasonable to convert all the actual transactions to $/pound. [Every simplifying assumption chips away at the reliability of the outcome.]
Food pricing gets complicated quickly. Comparing coffee made at home to coffee served away from home, the comparative unit was a 16-ounce cup of coffee. Comparing corn grain commodity price of $4 to a 12-ounce, $4-box of corn cereal, the comparative unit was what $4 U.S. dollars would buy. Today, our back-of-the-envelope comparison of wheat-to-pancake pricing, the comparative unit is the value of a pound of product at each level.
Attention must be paid.
Seemingly small changes really do change the story.
Pay attention, because we are leaving the comfortable reality of prices with units. Prices with units on tangible products are absolute values. An analytical tool that gets swapped instantly into dynamic analyses, are relative values. This means prices compared with other prices can become unitless. Price A is relative to Price B. It could be relative to the total of all goods. Percentages are relative prices. Price J is divided by the total of all prices, and it becomes a percent, or per-100 (total).
Another unitless value is an index. In my introductory agribusiness class while discussing prices, it was easy to divide all prices in a collection by the commodity, or the intermediate product, or the retail price. Whatever value in the numerator is divided by the comparative denominator, or the numerator value is relative to the denominator. This happens quite often in the real world, but generally with less attention to the absolute/relative value differences.
The Consumer Price Index (CPI) is current US economy-wide prices divided by the same prices from 1982-1984. Sometimes prices in a time-series are divided by the first price, or the last price. And then the analytical benefit is the change between one price and another price, rather than the actual $ per unit price (absolute). Absolute values provide one kind of information. Relative values provide another kind of information. Both are important, and both get used like everyone understands how they differ.
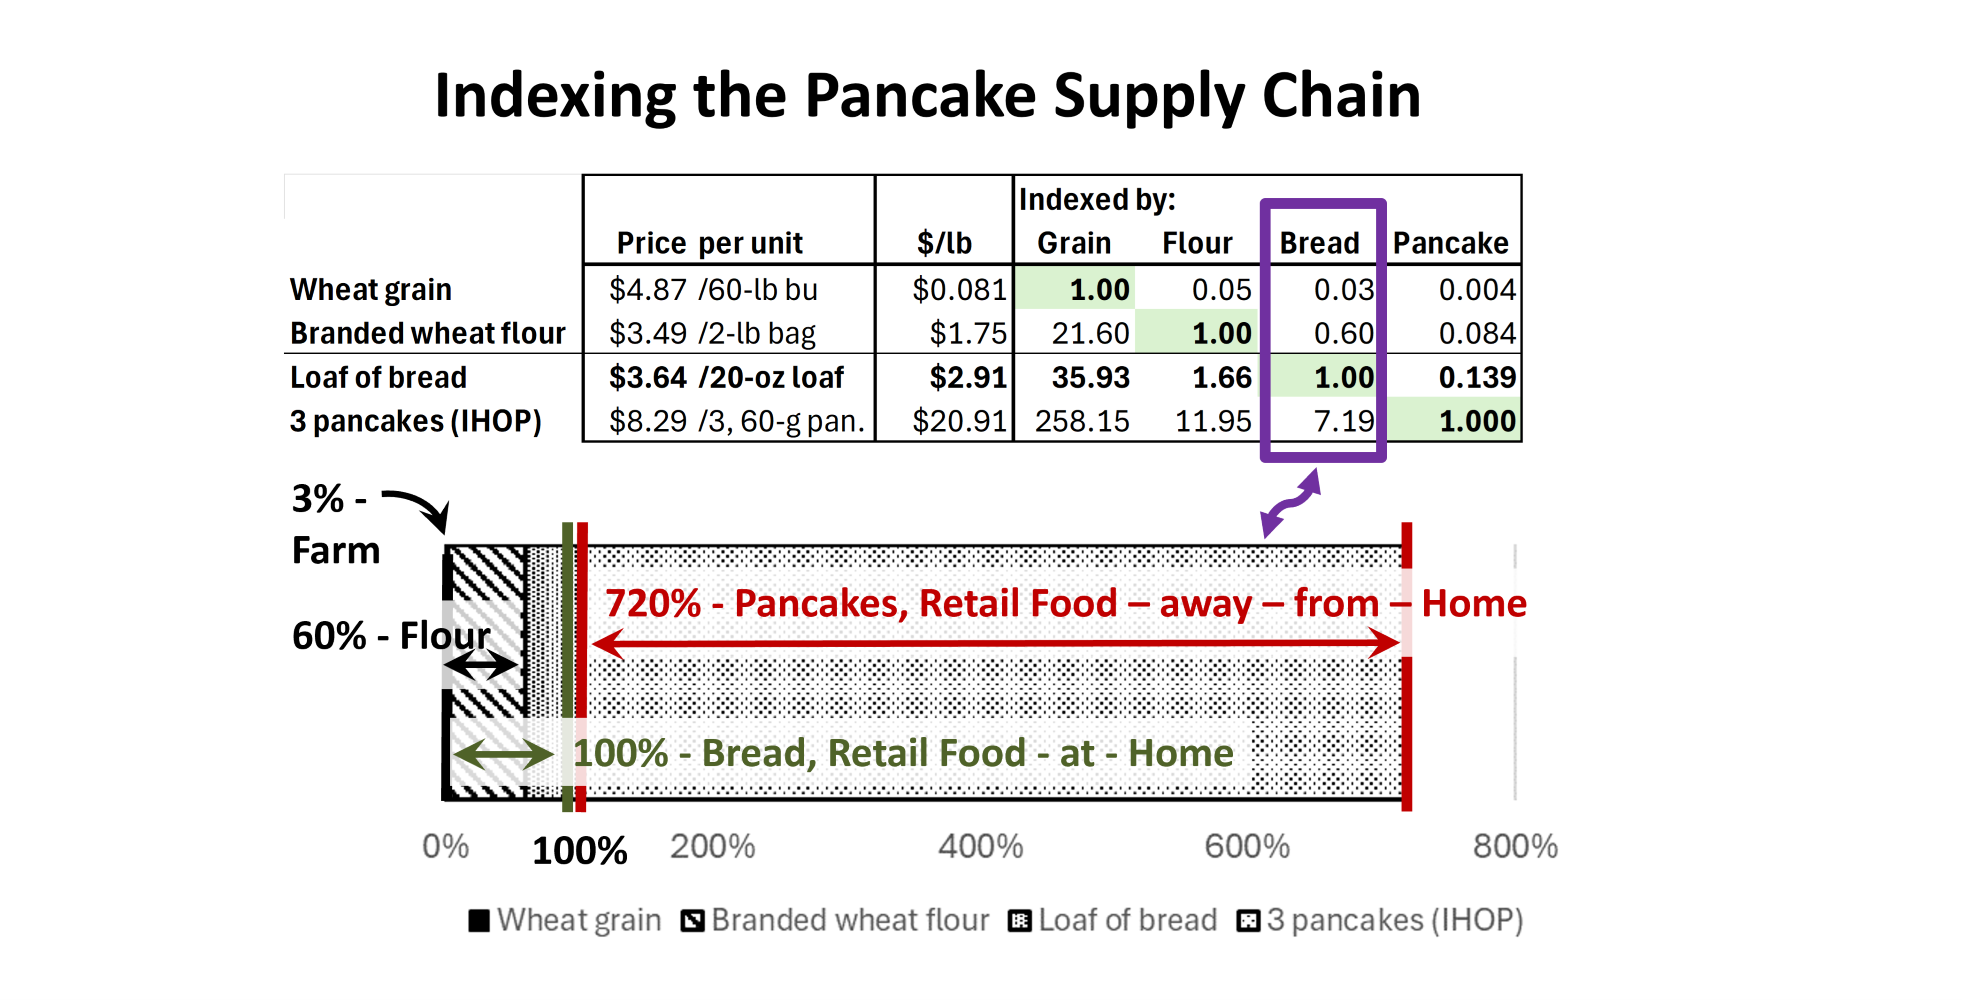
The second part of today’s table is an explorative index for each of these four supply chain values. In the column, Grain, all four prices are divided by the price of wheat. It is the per-pound price of $0.081/$0.081, or 1.00. In this column all prices are divided by the wheat grain price.
The Flour column is divided by the price of wheat flour per pound. The Bread column is divided by the per-pound price of bread. And the Pancake column is divided by the per-pound price of 3 pancakes served at IHOP. This also works well for any sandwich purchased at a restaurant, these days a sandwich serving is largely bread by weight and costs a similar amount. We realize that while flour does result in both bread and pancakes, pancakes are not made from bread. But is works in the illustration.
The USDA, ERS Food Price Outlook, 2024 and 2025, last week reported that At-Home food prices were lower than the all-item price inflation (CPI) and much lower than the Food-Away-From-Home prices. In our case of pancake supply-chain pricing story, the retail price of grocery store food feels like a solid reference point, rather than the total of all supply chain prices. The chart below the table is based upon the Bread price index. Each value in the table is multiplied by 100 to reflect a percent. This mimics the USDA, ERS, food dollar series. Conveniently percentages and cents in a dollar both equal 100. Except in the food dollar series, the prices of each level are summed for the denominator.
In the chart, wheat prices are $0.03 of $1.00 of bread. Wheat flour is $.60 of $1.00 of bread. Restaurant served prices of pancakes are 700 percent of the price of bread, or $7.19 more than $1.00 of bread. Three, 60-gram pancakes is 180 grams, or one third of a pound. For grains this is a common story. While there are some who will manipulate a system for their gain, this is not the case here. Moving from the farm to the table (at home or a restaurant) it simply costs more to deliver. It costs much more in cooks, servers, and dishwashers, as well as the investment in the building itself, to serve customers in retail food-away-from home.
The U.S. food production and delivery system is ridiculously efficient. Competition, comparative advantage, specialization of resources, and transfer of property rights, all make it a remarkable market transfer success.


Comments
A Case of Pricing Wheat from Farm to Food — No Comments
HTML tags allowed in your comment: <a href="" title=""> <abbr title=""> <acronym title=""> <b> <blockquote cite=""> <cite> <code> <del datetime=""> <em> <i> <q cite=""> <s> <strike> <strong>