

Farm Digesters are Busting Out All Over
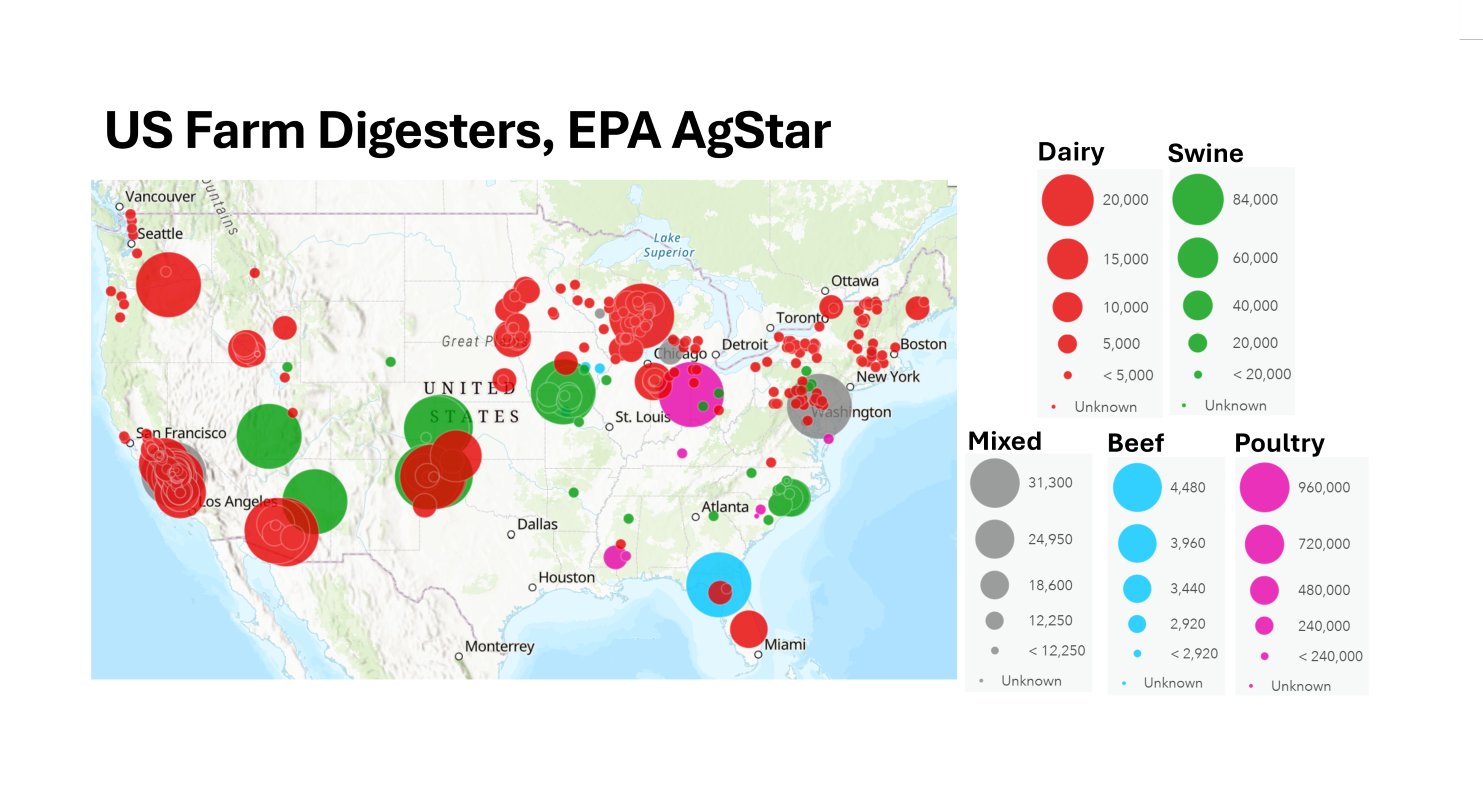
This fun map from EPA, AgStar farm digester website gives a striking visual of the distribution of US farm digesters. The largest digesters are fewer than ten years old.
This dataset was last updated in 2024. At that time there were 400 farm digesters. In 2004, the same dataset reported 28 farm digesters.
Because of the very different size of digesters this type of chart helps illustrate that different size farms are producing methane from manure. Note that the different species have different animal numbers associated with the different-sized circles. The largest circles exaggerate the local impact. Those farms do not take over the entire state (Missouri, Indiana, Wisconsin, or Florida).
This map was already prepared for viewing by EPA. There are more meaningful metrics from which to compare digester projects than number of animals. We will explore these in the coming months.
Comments
Farm Digesters are Busting Out All Over — No Comments
HTML tags allowed in your comment: <a href="" title=""> <abbr title=""> <acronym title=""> <b> <blockquote cite=""> <cite> <code> <del datetime=""> <em> <i> <q cite=""> <s> <strike> <strong>