The Producer (Farmer) Role is Transformative
The previous post, The Price of Food Dominates Alternative Use Markets, sparked a desire to map out the farm-level activities into feed, fuel, and food. This was an innocent effort and was not successful. The transformations that occur on a farm, are not the retail markets where product demand is defined. It was a good exercise in remembering supply-chain theory.
Data Metrics
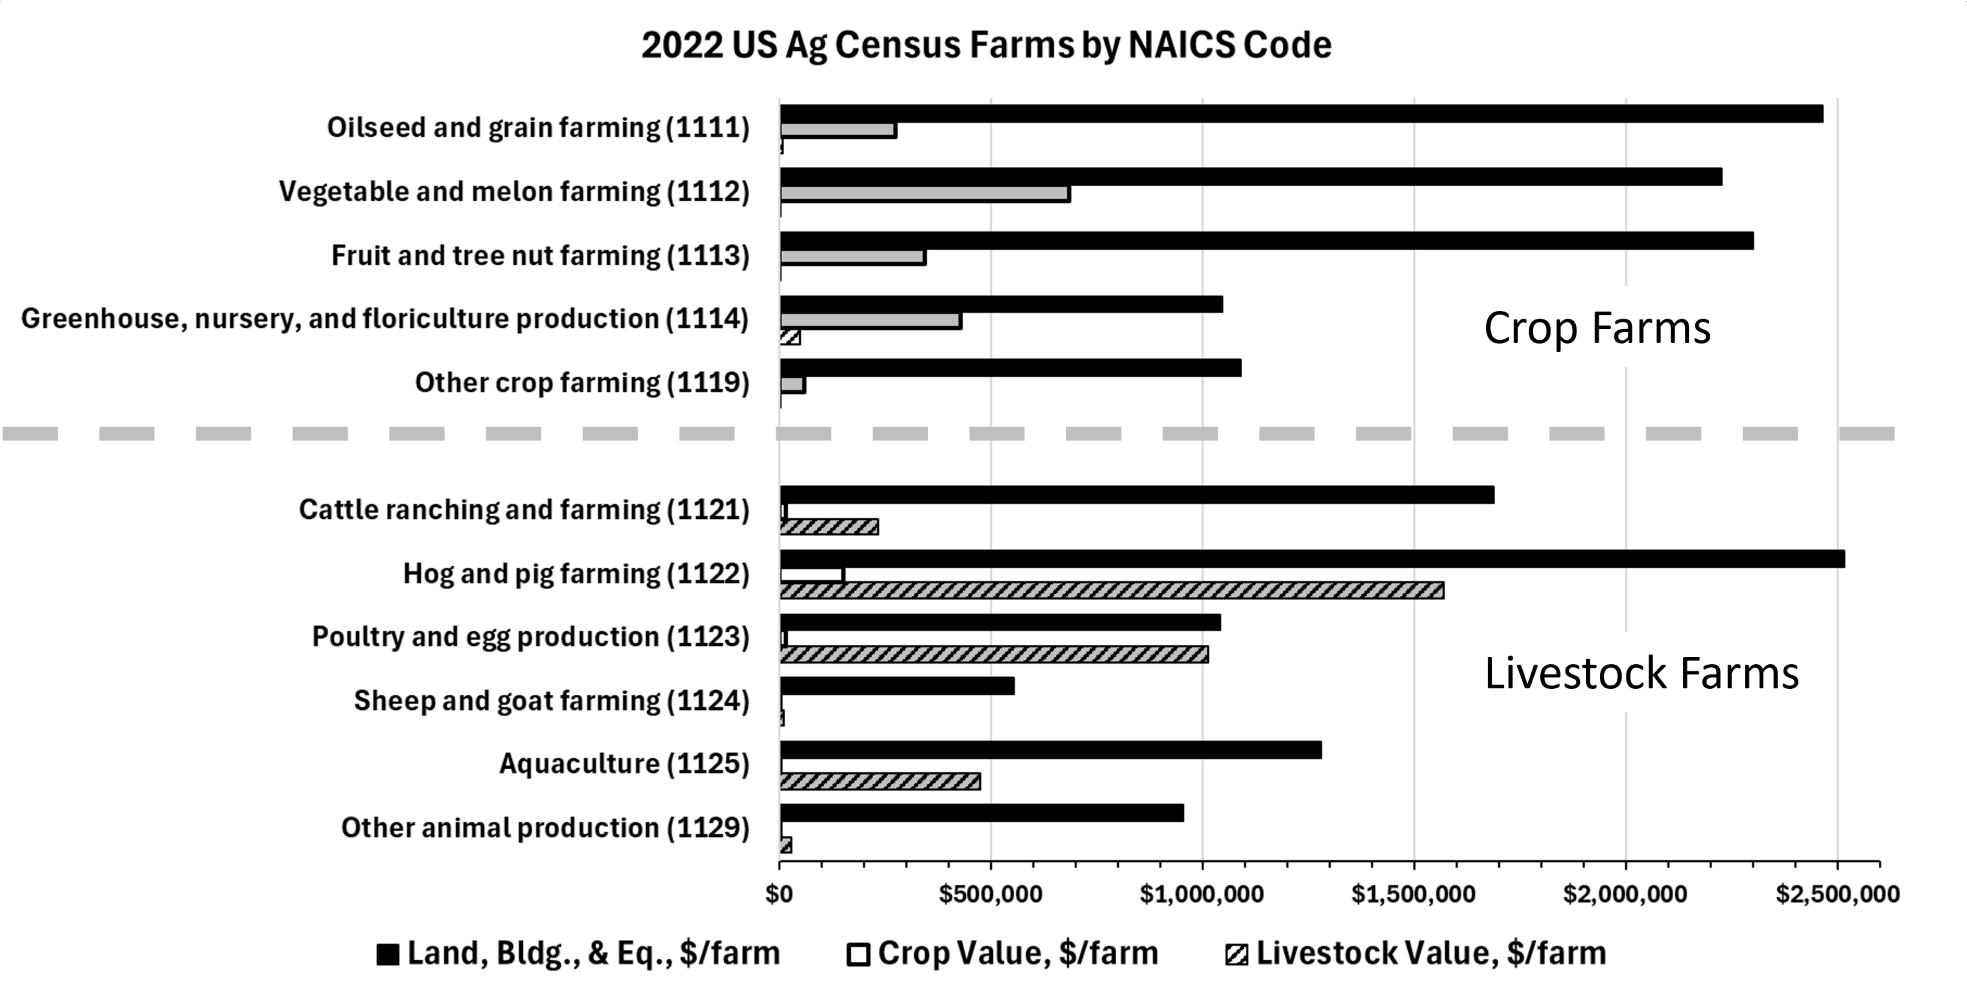
This chart is a summary of Table 48 in Volume 1 (US. data) of the 2022 USDA Census of Agriculture. This table presents the 1.9 million US. farms recorded in the Census of Ag by their North American Industrial Classification System (NAICS) number. Table 48 presents from 3 to 6 digit, or character, NAICS data. Three digit NAICS is the broadest level that simply separates crop production (111) from livestock production (112). As more digits are added, the data is at a more detailed level. Cattle farms are for characters (1121). Beef operations are (11211) with dairy operations at (11212). But beef operations are split into ranches (112111) and feedlots (112112). The data in this featured chart are 4-digit NAICS.
Innocent Effort #1 (E for Effort)
Not all farm production goes to food. Often livestock feed is produced on the same farm where it is fed to livestock or poultry. Using some basic assumptions like we don’t eat cotton, flowers and other ornamental plant, or wool, it was possible to do some very coarse aggregation into food commodities, feed commodities, and non-food commodities. Based on a value-of production measure, 60 percent of farm production was for food processing, 30 percent for livestock feed, and 10 percent was non-food production.
We just established that food dominates the other markets in value. So even though it strained some boundaries of reasonable assumptions, it seemed intuitively correct. …And then the theory began to kick in.
The end use demand determines the market (food, fuel, or feed), not the farm. It is true some vegetable produce and eggs, leave the farm for the store, but those are exceptions. Forages grazed don’t have established markets. Hay and silage does move through markets, but much of that production never passes through a market (used on site). Bioenergy markets occur after the farm. Even soybeans get processed into oil and meal after the farm. Cotton is composed of non-edible fibers and very edible cottonseed meal. The assumption flaws outweigh the result benefits.
The analysis was too innocent and tried to get the data to do more than it could. But like any good economist when the hypothesis isn’t validated the question was asked, “What do we have that is salvageable?” Nearly every table in the Census of Agriculture has a rich story. What is presented here is only one great story.
More Useful Effort #2
Table 48 presents data from 1.9 million farms in quantities of farms, acres, asset value, and value of production (sales). The data in this chart is all on a ‘per farm’ basis. Four-digit NAICS codes for crops and livestock are presented on average asset value (black bars) and value of production for crops (open shading) and livestock (cross-hatching). Because everything is on a per farm basis, farm number isn’t included. Farm numbers vary significantly across categories, but there are limits to how much can be digested in a single chart. That is for a later analysis.
The crop bars are shaded in the crop NAICS data and the livestock bars are shaded in the livestock NAICS data. What leaps off the chart are:
- Oilseeds and grain farming, Vegetable and melon farming, Fruit and tree nut farming, Cattle ranching, and Hog and pig farming ALL average between $1.5 and $2.5 million dollars in land, buildings, and equipment assets per farm.
- All crop farms categories produce some livestock and all livestock categories produce some livestock, but the non-primary category on average in the nation, is a small player compared to the primary commodity.
- The ‘Other’ crop farms and ‘Other’ livestock farms require about $1 million dollars in assets, but yield very low values of production.
- Sheep and goat farms only hold about $500,000 in assets but produce effectively zero value of production ($12,000 in value of production on average in 2022).
It is important to remember that 2022, the Census data year is a point in time, and a couple of years ago. There are limits to how broadly this information can be extrapolated.
The take home message is the role of farms, the producers of the agricultural value chain, is to transform products. My favorite definition of this role is y=f(x). Output, y, is a function of the inputs, x. Farms transform inputs into outputs. The rest of the value chain moves them into the most demanded goods and services.


Comments
The Producer (Farmer) Role is Transformative — No Comments
HTML tags allowed in your comment: <a href="" title=""> <abbr title=""> <acronym title=""> <b> <blockquote cite=""> <cite> <code> <del datetime=""> <em> <i> <q cite=""> <s> <strike> <strong>