

For 40 Years, Real Cost of Thanksgiving Meal Price Remains Constant
Serving as the American Farm Bureau Federation’s Thanksgiving economist in the 1990s was a pleasure. The cost of food thirty years ago was generally good news, so there was no downside. Unlike most of the more contested issues I worked on a daily basis, giving consumers good food news in November was enjoyable. It still is.
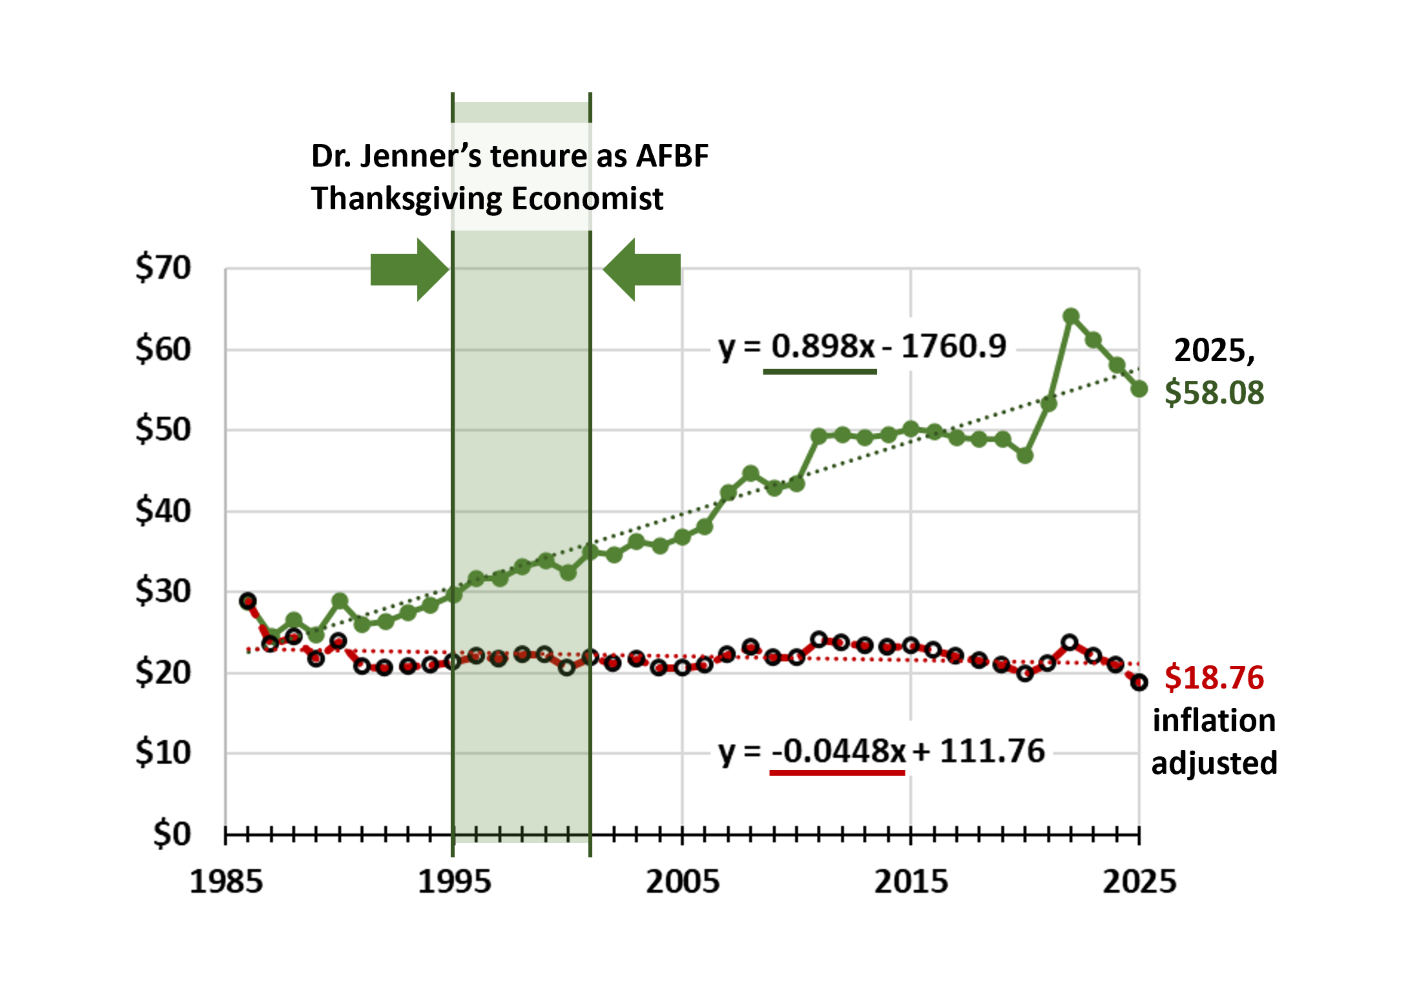
Today’s chart is frequently published by American Farm Bureau Federation (AFBF) in their annual survey report, but it did not appear in this year’s 11/19/25 report. Biomass Rules is happy to supply it!
This fall the Bureau of Labor and Statistics (BLS), consumer price data is missing due to the federal government shutdown. The most recent price data for creating the inflation adjusted prices was in September. In this chart, the 2025 November inflation-adjusted prices are not indexed to the official November prices. Interestingly the January 2025 Biomass Rules evaluation of monthly food price shifts over 4 decades, Buckle Up for the 40-Year Cycle of Year-End Food Price Rhythm, shows that food prices consistently decline in October and November, and consistently increase in December and January. So, using the September Consumer Price Index (CPI) value for November 2025 is not a risk with food prices declining the last 2 months.
The slope of the linear regression trend line of reported nominal prices shows that over the last 40 years Thanksgiving meal prices have increased an average of $0.90 per year (0.898 in the upper equation). Adjusting for inflation the lower trend line is actually slightly negative. The slope of the inflation-adjusted prices is -0.0448, or it declines on average over 40 years by $0.04 each year.
There is always some slippage when adjusting for inflation over decades because across any economy there are more moving parts than are captured in a single price change. It is fairly safe to say that the cost of living accounts for most of the price increases of Thanksgiving meals over the last 40 years. The data and statistics are less certain to say that the real, inflation-adjusted, Thanksgiving meal prices have actually declined. It is worth planting the suggestion that it is at least possible. Having worked through those 40 years, improvements in genetics and technology, as well as infrastructure and access, make it is easy to infer that after adjusting for inflation, US consumers are getting more for less in today’s Thanksgiving meal grocery purchases.
The other interesting graphic provided by AFBF is the regional influence in prices. While the 2025 survey price was $55.18 to feed 10 people, this price was different by region. It is a nice reminder that the United States is a big place and one price doesn’t represent everyone.
- West – $61.75
- Midwest – $54.38
- South – $50.01
- Northeast – $60.82
A great value of the annual AFBF Thanksgiving Survey is that it is an authentic application of how economic theory works. Farm Bureau members across the country report prices in their area for a specific span of time. These prices are aggregated up to the national level and contain sufficient data to be credible. It is not as thorough as other institutional surveys conducted by USDA or the BLS, but it provides excellent fodder for the value of our food for very little additional cost. Well done Farm Bureau, your farming member families, and the competitive food industry in general!
Comments
For 40 Years, Real Cost of Thanksgiving Meal Price Remains Constant — No Comments
HTML tags allowed in your comment: <a href="" title=""> <abbr title=""> <acronym title=""> <b> <blockquote cite=""> <cite> <code> <del datetime=""> <em> <i> <q cite=""> <s> <strike> <strong>