Discerning Agribusiness in the Macroeconomy
The last seven years, Greenville University has been building a BS in Agribusiness, in their Briner School of Business. This has required a target market for arming agribusiness graduates, hungry for leadership in their formative careers.
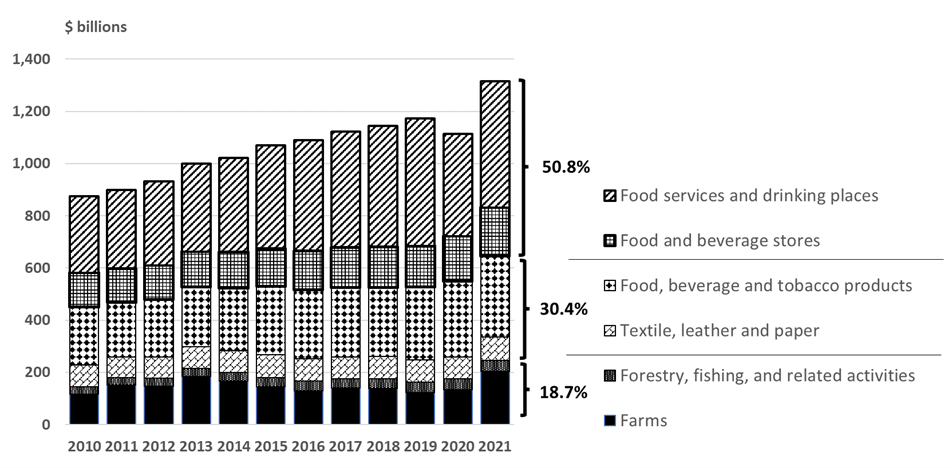
This chart from USDA, Economic Research Service (ERS) shows that in 2021 ‘agriculture and related industries’ provided $1.264 trillion, or $1,264,000,000,000, of the Gross Domestic Product (GDP).1 In 2021, that was 5.4 percent of the total GDP. This is a representative chart of agricultural industries influence on the U.S. macroeconomy.
But the next question is, what are ‘agriculture and related industries’? Well, they are 5.4 percent of US GDP in 2021.
Is this agribusiness?
This is the economic sector for which Greenville University students are trained to be successful, but if it was simply a model of agribusiness, the ERS would have labeled it as such.
I have redrawn it (in part because USDA, ERS makes it easy to do so). The horizontal lines in the legend break out the categories as:
- Production (farming, forestry, and fishing),
- Value-adding sectors (food, beverage, tobacco, textile, leather, and paper manufacturing), and
- Retail sectors (restaurants and grocery stores).
Curiously the retail sector represents only a market for food. Retail clothing, leather, and paper doesn’t fit into agriculture. Missing from this value of ag in the macroeconomy is the value of bioenergy. While the fuel that goes into ethanol, biodiesel, and renewable natural gas, quite likely came from agricultural products, the energy production sector isn’t generally considered agriculture, but it feels like bioenergy could be agribusiness.
The production sector here is nearly 20 percent of the total GDP value, the value-adding sector is 30 percent, and the retail sector is 50 percent of the total value of GDP.
But the definition of the GDP itself complicates this model. The Gross Domestic Product is a measure of the value of final goods and services. Value is added as it moves from inputs to final goods and services, but the full value of each transaction is not included. For the most part, reuse is not included. Resale of used equipment is not part of GDP. Compost and fuel, like renewable natural gas, from rotting organics, are not part of the GDP.
For very good reasons, these numbers do not provide a definitional model of agribusiness, but conceptually, it seems to cover it.
Perhaps definitionally it comes more closely to what a bioeconomy – a biologically-dependent economy – might look like. But again, making things out of plants, like lumber, furniture, housing, and clothing doesn’t connect with agribusiness necessarily. Bio-based plastics and building materials are not considered agribusiness either.
This is still a legitimate model of the value of U.S. agriculture at 5.4 percent of the GDP, even if we can only connect it conceptually. Even though definitional challenges can be identified, it illustrates an approximate value of agribusiness. The non-agricultural sectors can be successful without fitting into an agribusiness label. While this has been my challenge building a BS in agribusiness at Greenville University. A target was needed. This is shared, here, because there are many places that agri/bio/carbon/environmental look similar, but don’t quite fit together.
My biomass-loving world does not fit nicely into the functional world of traditional economic data even as the economy is experiencing an increasing reliance on plant-derived products. And yet policy makers, investors, entrepreneurs, and environmental leaders are anxious for pieces that fit together. We are called to find those straighter pathways.


Comments
Discerning Agribusiness in the Macroeconomy — No Comments
HTML tags allowed in your comment: <a href="" title=""> <abbr title=""> <acronym title=""> <b> <blockquote cite=""> <cite> <code> <del datetime=""> <em> <i> <q cite=""> <s> <strike> <strong>