Setting Economic Model Context and Boundaries
The first 15 years after high school were spent chasing windmills, because in those early years of adulthood, all the answers were obvious.
- Go to college and become smart enough to change the world (age 18 to 22).
- Save the world by teaching others to grow food in the Peace Corps (24 to 26).
- Come home and farm (age 26 to 30 years old).
When the solutions didn’t provide anticipated outcomes (success), doors opened in graduate school to learn all the things I didn’t know how to do. It only took 7 years of graduate school and 3 degrees to arm me with tools to model the future more relevantly.
Living life with family, work, and bills, it took another 30 years to appreciate the power of that accumulated knowledge.
Data and Model Selection Shape the Outcome
I built a ‘survey of models’ class to the Greenville University, B.S. Agribusiness program. Students needed to realize that ‘The Answers’ that appeared in the news each day all had different implications. The GDP, economic impacts, agricultural forecasts, and life Cycle Assessments (LCA, for carbon footprint estimation) are created differently for different purposes and have different implications.
Nearly every Biomass Rules post represents an economic, agricultural, or biomass value model. Models are imitations of reality. Forecasts are models. Patterns found in historical data are models. My early blogs showcased agribusiness models
- What is Agribusiness? A Good Place to Begin… – based on GDP and agricultural-related goods.
- Discerning Agribusiness in the Macroeconomy
- Academic Agribusiness in a Microeconomic Model
- A Tale of Two Markets: Local and Global
- Agribusiness Markets Go Well Beyond Food
Here are five different models of agribusiness. Are these all the same agribusiness industry? Yes. Like the story of the seven blind mice on the elephant, each mouse describes a different part (ears, trunk, feet, tusks, tail, back, etc.). They were all correct, but each one described local parts of the same elephant differently.
Each Problem and Solution Require Boundaries
Problem and solution boundaries are often obvious to many people, but the resulting boundaries may not be the same. This is one reason economists agree on consistent theoretical methods, but often do not agree on solutions. They each use different boundary conditions.
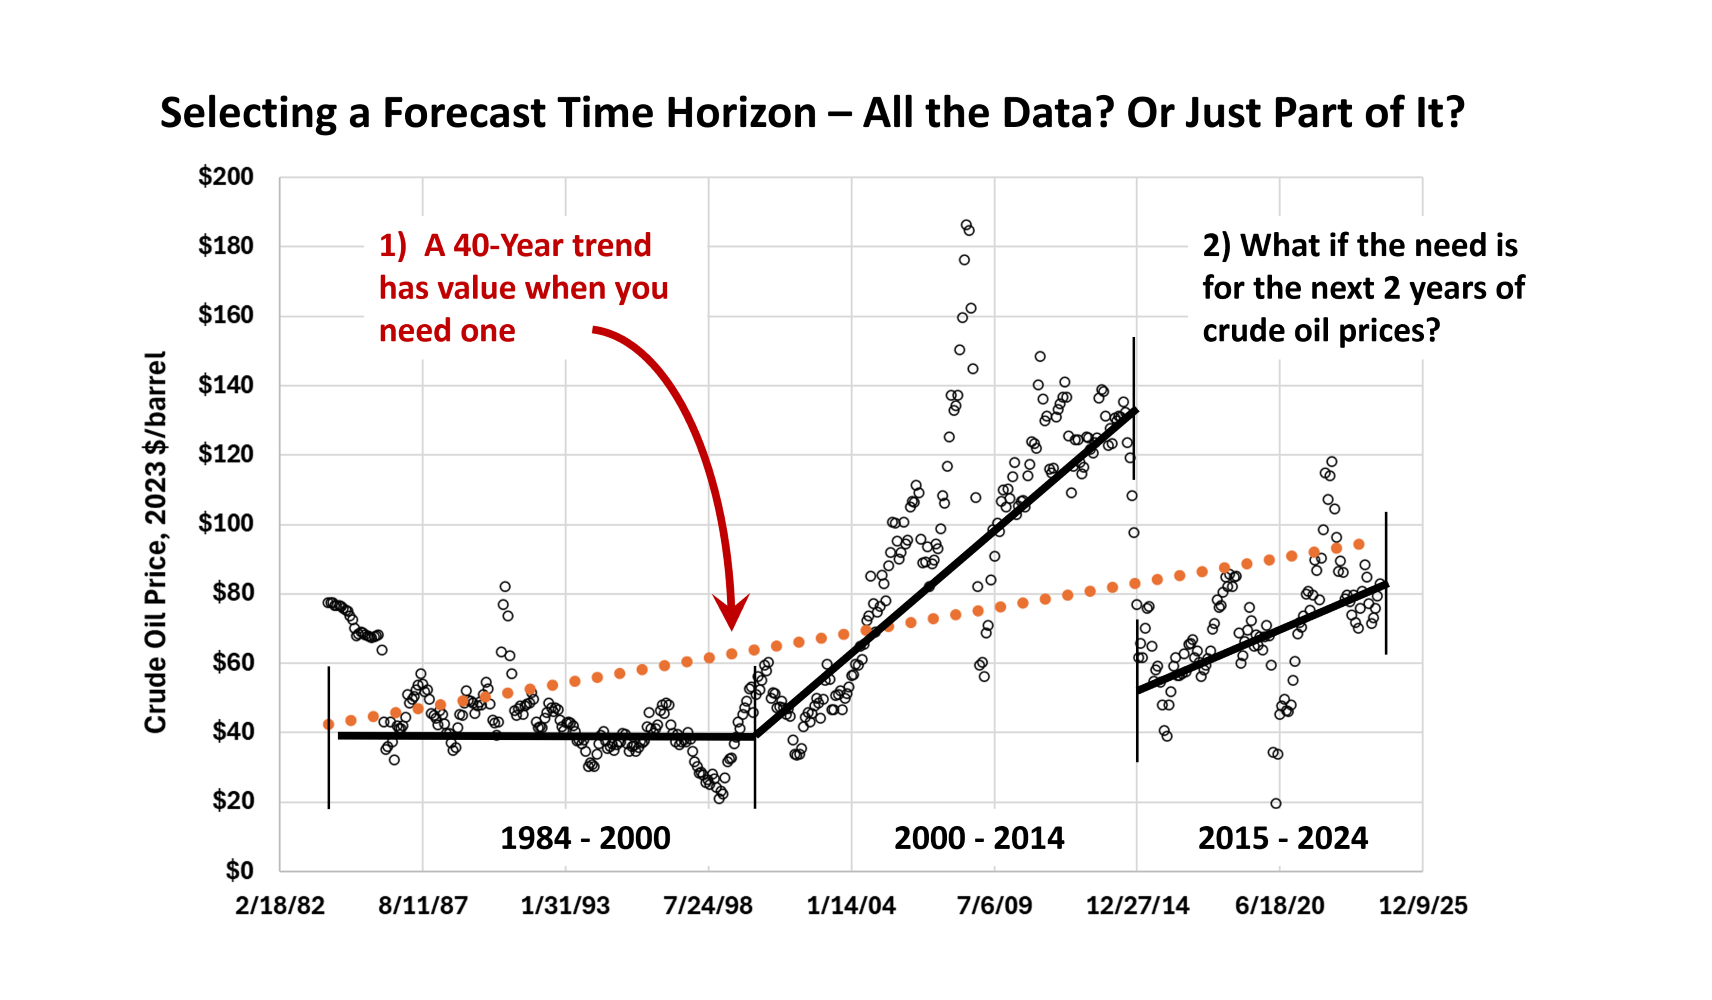
Looking at monthly crude oil prices again, a forecast that was going out a decade or more beyond the most recent data point requires more years of data. Over the 40 years of data in the chart presented today show increases and decreases in prices. The long-term trend is the steadily increasing (dotted) line.
This makes some intuitive sense. As economies develop around the world, there is a hunger for more energy. Global demand is increasing, therefore global energy prices will likely increase.
In the shorter term, there are multiyear price patterns. This chart shows shorter-term trends in three solid black lines over the same 40-year period. The monthly crude oil prices are the same data. But breaking the data in three, segments tell a different story.
This data series begins, intentionally, after oil prices settled down in the 1970s. To tell this story, some volatility was removed before we began. Boundaries were set.
From 1984 until the year 2000, there was not much increase in crude oil prices. Then from 2000 through 2014, the price of crude oil was more volatile and generally increased during that time period. There are multiple reasons for this. Part of it is tied to the September 11, 2001, terrorist attack. The United States felt vulnerable in its dependence on foreign oil.
By 2015, the United States was less dependent on foreign supplies of energy. The prices reset (dropped). Over the last decade, crude oil prices have been again climbing. The last solid black trendline has a steeper slope than the longer-horizon dotted trendline.
Select the Time Horizon Used for Analytical Need
When forecasting one or two periods beyond the data, it is more important to focus on near-term data. If the target was crude oil prices 12 months out, looking at the most recent and relevant time-period will give a better forecast than using all available data.
Forecasting crude oil prices is very complicated. This blog is only an illustration. When looking at the growth of the economy or energy consumption, population has an influence. By looking at the change per person or per capita, the population impact can be reduced.
The model or series of equations matters. The boundaries of the data matter. There are lots of rules. Most of the knowledge learned in a quantitative economics graduate program is centered around learning the acceptable boundaries of data and equations.
It is not just about the rules and boundaries. Another economist would likely break the shorter-term trendlines in different places for reasons based on their own unique training and experience.
All of these variations add to the pool of available decision points. Software technology allows both ease of useful solutions, and potential faux solutions that don’t follow the rules. Professionally trained economists enjoy exploring how analyses were derived. Both to learn new techniques and to ground-truth the credibility of the presentation.
Boundaries provide structure and stability. A key to effective boundaries is that they need to meet acceptable standards. When boundaries become more subjective than objective, they become barriers. Just as math can be intimidating initially, the modeling boundaries and rules may also be. Economics is the study of choice. We all make choices. A hope is that these blogs will demystify the jargon.


Comments
Setting Economic Model Context and Boundaries — No Comments
HTML tags allowed in your comment: <a href="" title=""> <abbr title=""> <acronym title=""> <b> <blockquote cite=""> <cite> <code> <del datetime=""> <em> <i> <q cite=""> <s> <strike> <strong>