Modeling Farm Income versus Farm Household Income
Over the last few decades, financing the family farm has shifted. Farm policies and farm management begin with the idea of a farm as the central business unit of a farm household. This is an excellent place to begin. But as the farm economy has evolved, the farm business as a primary household enterprise is not representative of US farm households.
The USDA, Economic Research Service (ERS) does and excellent job of documenting the farm economy. ERS works jointly with USDA, National Agricultural Statistics Service (NASS) to collect and maintain the Agricultural Resource Management Survey (ARMS). Under Tailored Reports, it is possible to filter the farm income by farm type, or typology. This data has many facets and is collected periodically for 15 or 16 states and adjusted for the nation.
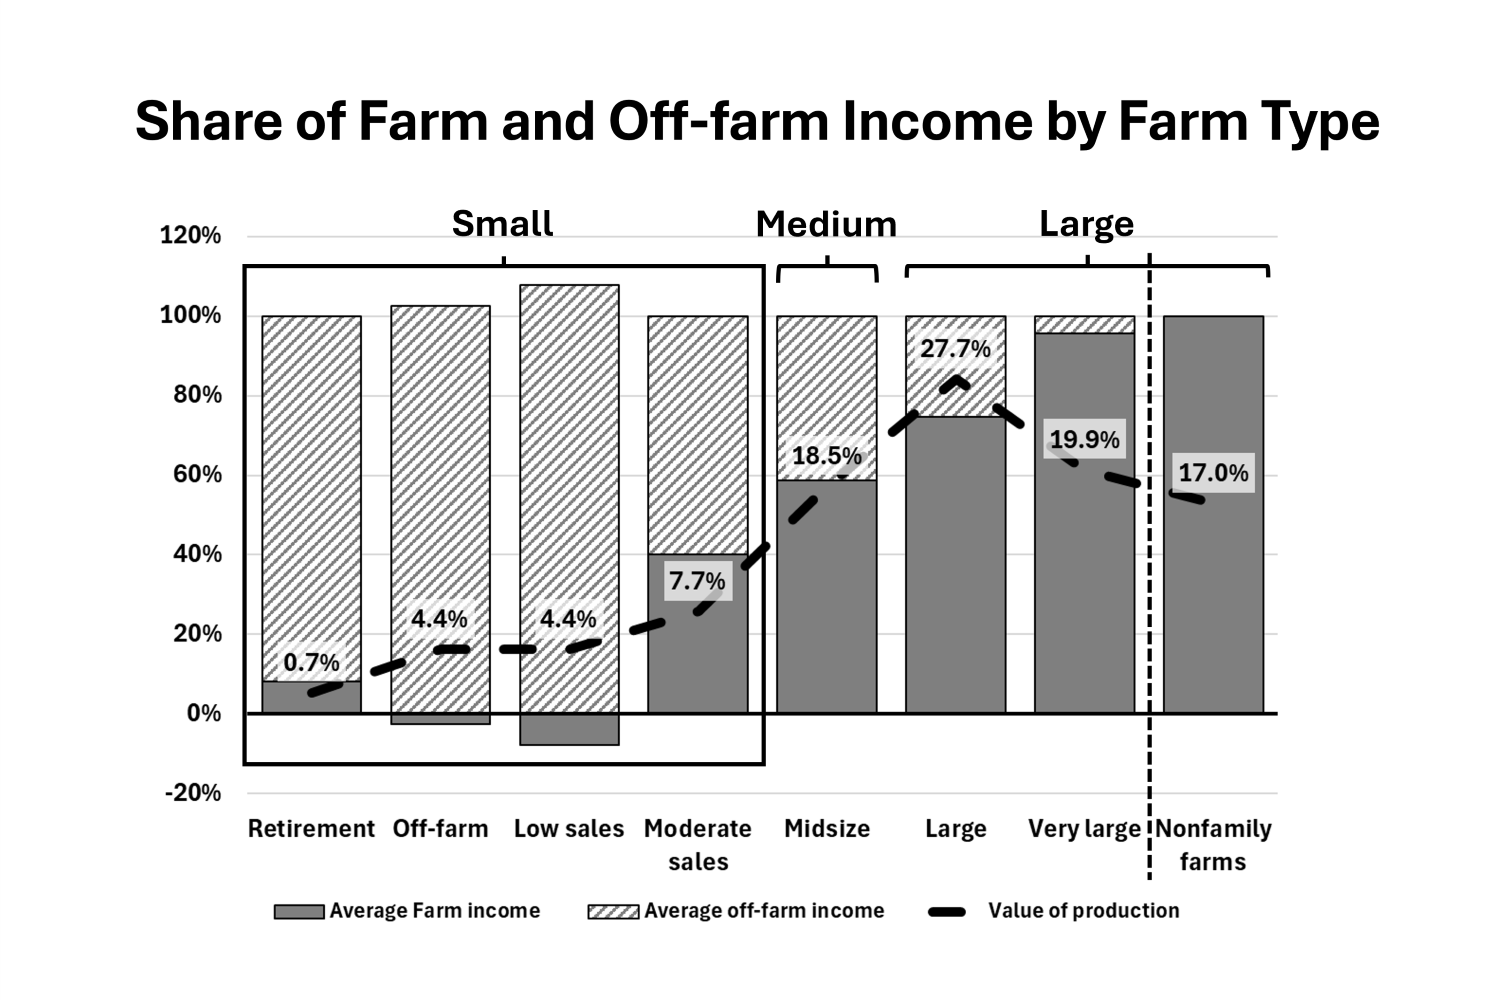
Today’s chart is from data provided in the ERS publication, America’s Farms and Ranches at a Glance: 2024 Edition. This chart isn’t in the publication, but is composed of farm type information provided in Table 1 and Table 3 of the document for 2023.
The first four farm types are considered small farms with less than $350,000 in annual gross cash farm income (GCFI). This is the total inflow of revenues before costs are removed. But these four small farm types have different management frameworks. ERS defines small family farms as: Small family farms (GCFI less than $350,000)
- Retirement farms: Farms whose principal operators report having retired from farming while continuing to farm on a small scale.
- Off-farm-occupation farms: Farms whose principal operators report a primary occupation other than farming.
- Farming-occupation farms: Farms whose principal operators report farming as their primary occupation. Farming-occupation farms are further sorted into two classes:
– Low sales: Farms with a GCFI of less than $150,000.
– Moderate sales: Farms with a GCFI between $150,000 and $349,999.
While the last two farm types, low and moderate sales, consider farming their primary occupation, all of these farm types average more than fifty percent of their income from off-farm jobs in 2023.
Even the medium, Midsized farm type has an annual average of forty percent of their income from off-farm sources. The Midsized farm type is defined as having GCFI between $350,000 and $999,999. This is gross farm income, not net farm income. The average annual off-farm income for this farm type is $92,000 per year.
The large and very large family farms also have smaller shares of household income from off-farm sources. The non-family farms have no off-farm household income because, by definition, they are not family farms.
Median versus Average Farm Income
Using the median farm income indicates a farm income level that is representative of more farms than the average farm income does. For the first three farm types in the chart, the 2023 median farm income is 80 percent of the average farm income. When the average Retirement farm income is $98,000 per year, the median Retirement farm income is $78,000. For all the farm types the median farm income, the data at the midpoint of the series, is lower than average income, except for the small farm with moderate sales. This one category the median and the average income are the same.
When looking at the off-farm income levels, it is not possible to compare the medium, or midpoint of farm incomes with the median, or midpoint of off-farm incomes. The median values for each farm and non-farm income levels do not align. However, it is appropriate to look at the share of household income for the average income levels. The average household farm income does correspond to the average household off-farm income. For comparing farm to off-farm income the average income levels are more representative.
Most notable in the comparison of farm household farm to off-farm income shares are the three smallest income farm types have nearly no farm income. The off-farm income and low sales farms have negative farm incomes for 2023. For all four of the small farm types, off-farm income is a risk management tool. With this significant flow of funds into the household from off-farm sources, these farms do not fit the traditional farm as a primary profit center model. This means that comparison of these less traditional income flow farms to annual university planning budgets will not look the same.
The farms with the very largest farm type and the non-farm types most closely resemble the traditional university planning budgets. These two farm types finance the entire farm operations from farm-generated resources. These farms represent 5 percent of the US farms counted by USDA.
Developing Farm Household Financial Models
The smallest four types of farms in 2023, covered 86 percent of the farms. The dashed line in this chart shows the share of farm value delivered in 2023. The smallest farms accounted for 17.2 percent of the value of production. This is significant from both a farm input, asset ownership, and accounts for the valuable contribution of one sixth of the total production. This is the pool from which future farmers arise and life-long farmers retire. But these farms do not fit traditional farm financial models.
Traditional farm financial models still work for the other farm types. These account for 82.8 percent of the value of production, but only 14.4 percent of the farms.
Since 1997, USDA and cooperative extension have repositioned themselves to serve the smaller farms. In 1997, the Commerce Department changed their definition of a US farm to a value of sales of $10,000 from $1,000 per year. This would have reduced US farms by 75 to 80 percent. This is when USDA inherited the Census of Agriculture work and maintained the farm definition at $1,000 value of sales per year.
While services have shifted, in many cases, farm business management tools are still evolving. Some of this is because a $100,000 tractor is still $100,000 tractor and $4/bushel corn is still $4/bushel corn, no matter which size farm is involved. What seems to be different today is the role that off-farm income plays in building farm household equity.
While building equity is important for all these farm types, the role in that equity accumulation is not only from farm income. There is a need for new farm household planning models.


Comments
Modeling Farm Income versus Farm Household Income — No Comments
HTML tags allowed in your comment: <a href="" title=""> <abbr title=""> <acronym title=""> <b> <blockquote cite=""> <cite> <code> <del datetime=""> <em> <i> <q cite=""> <s> <strike> <strong>