

Ethanol Production Optimizes Outputs – University of Illinois
On the eve of USDA’s Ag Outlook Forum, Scott Irwin posted his analysis, Trends in the Operational Efficiency of the U.S. Ethanol Industry: 2024 Update. It looks at four simultaneous outputs: ethanol, DDGS, corn oil, and CO2, from dry-mill ethanol plants, and how those output levels have shifted relative to the input of a bushel of corn.
It is brilliant!
Professor Irwin’s analysis stands on its own. From one bushel of corn over the last decade,
- Ethanol output has increased from 2.80 gallons to 3.00 gallons.
- DDGS outputs has decreased from 17.34 lbs. to 14.78 lbs.
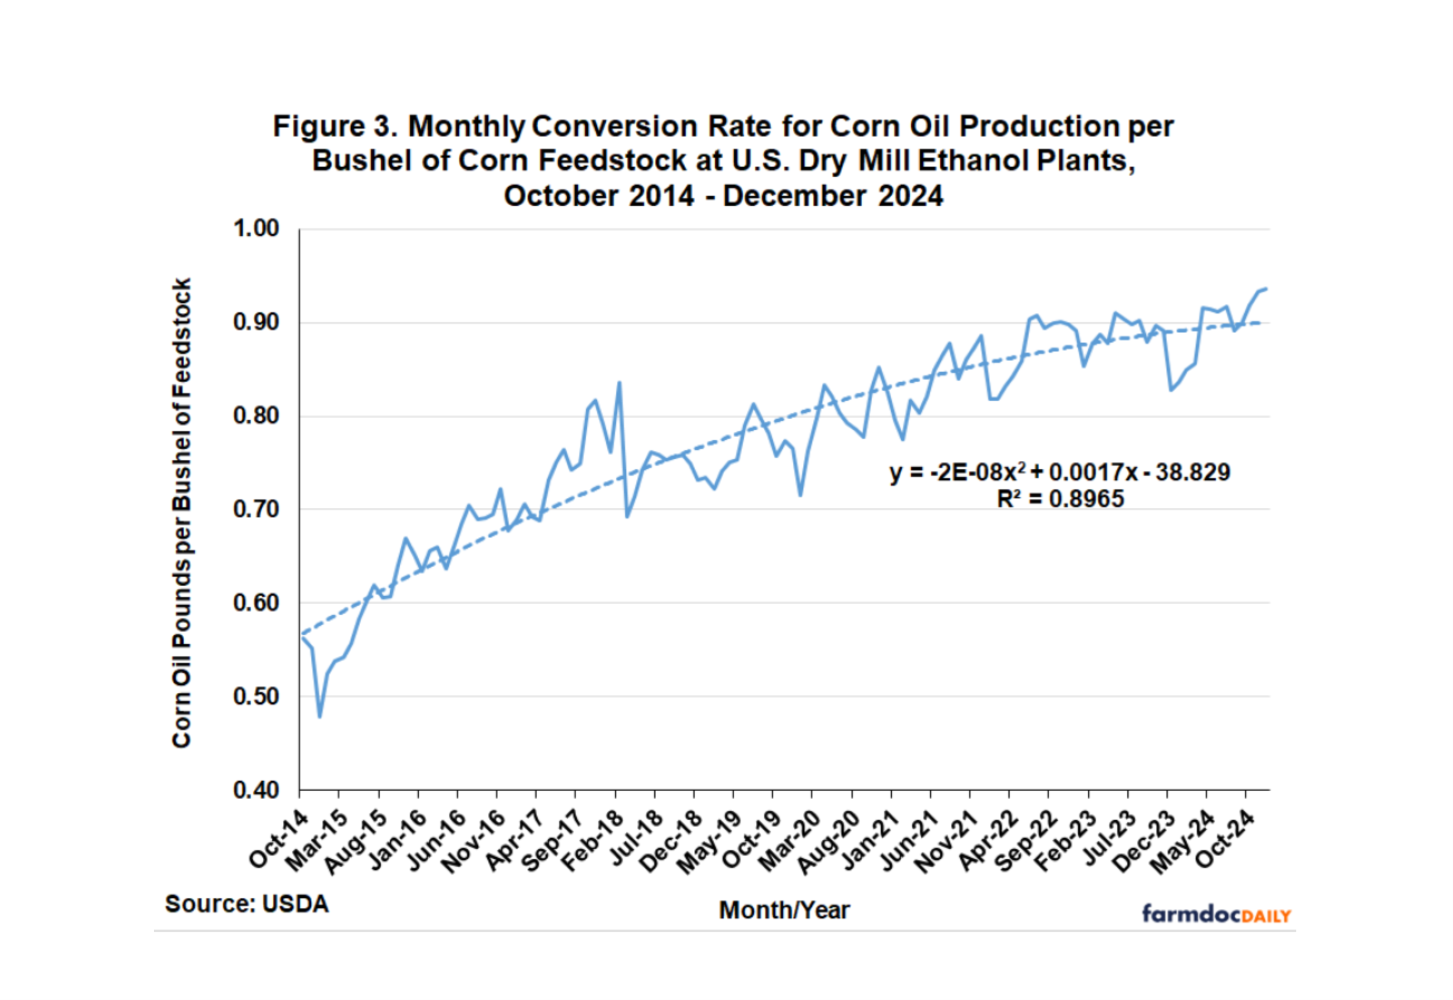
- Corn oil output increased from 0.48 lbs. to 0.94 lbs.
- CO2 output was effectively unchanged.
Scott Irwin took great care to be conservative in conversions and conclusions from this analysis.
The first adjustment reported was separating the wet mill ethanol facilities from the dry mill ethanol plants. The wet mill plants have been around for nearly 50 years. ADM (wet mill technologies) began producing Ethanol in the 1970s under the Carter Administration. More recently with the substitution of ethanol for MTBE in the early 2000s, the dry mill industry took off. Dr. Irwin estimated that the wet mill ethanol production accounted for 9 percent of overall ethanol production.
Wet mill plants represent traditional refineries, or a textbook example of economies of scope. Economies of scope look at fixed cost savings from producti0n of multiple outputs from a specified level of capital investment. Crude oil refineries may produce hundreds or thousands of different products from their unique investment in a facility to do so. This spreads the fixed cost of production across many products/outputs.
The more common analogue to economies of scope is economies of scale. Economies of scale focus on spreading fixed costs across greater output of a single product/output. The output per unit of 1,000,000 units is much less than a facility that may only produce 1,000 units.
Economies of scale highlight the benefits of specialization. Economies of scope highlight diversification (multiple products) of production. The math is much easier for economies of scale than scope, so we see more analyses about single-product production.
The reality is that it is very difficult to produce only one output. Making a cup of coffee produces coffee (20 percent of the bean). The remaining 80 percent of the bean results in coffee grounds. Egg laying chickens produce eggs and chicken manure. But the revenue-generating product is the focus (coffee and eggs) while the byproducts (coffee grounds and manure) traditionally are not included in the facility optimization.
Soybeans and soybean meal play significant roles in creating the value of soybeans. These to products are traditionally analyzed together. With the advent of biodiesel there are times when the much smaller quantity of soybean oil value drives planted acres. Historically, the total value of soybean meal has influenced future soybean planted acres. But in this market, the industry is comfortable comparing more than one product.
A fun part of the University of Illinois ethanol efficiency evaluation is that twenty years ago, prior to 2005, DDGS had a lower value. Back then, ethanol plants were looking for value-adding ways to utilize distillers grains. The feed value of DDGS back then, became elevated and like soybean meal, began to be included in the optimization of outputs. By 2010, the ethanol industry had realized that corn oil although produced in small amounts, could add significant value. It was not until 2014 that USDA began aggregating this data in the Grain Crushings and Co-Products report. But in 2004, both DDGS and corn oil played more of byproduct role as a waste liability than a value-added product.
The ethanol industry’s fierce attention to finding ways to add value to the initial single focus on gallons of ethanol is remarkable. But over the last 10 years, the higher valued outputs of ethanol and corn oil have increased in production. DDGS have decreased in production, a mass balance reality of the weight of a bushel of corn being fixed. However, it is interesting that the decline of DDGS in output per bushel, did not lower the estimated total per-bushel value of outputs from a dry mill ethanol plant in 2024.
This analysis captures the work of Biomass Rules, LLC. Total outputs, including byproduct wastes, can be optimized and upgraded to serve higher valued markets. But only if the undervalued byproducts are evaluated. It does not simply happen. Building systems that are interdependent on other systems require more complete understanding of technology, markets, and policy. But like the increased value of DDGS and corn oil in the dry mill ethanol plant industry development, they do happen.
Finally, a dry-mill ethanol plant historically focused on economies of scale. What is the optimal capacity of an ethanol plant in millions of gallons to lower the capital cost per gallon to a feasible solution. But as DDGS and corn oil outputs have been added to the ethanol revenue flow, they are also benefitting from economies of scope. Economies of scale and scope are not mutually exclusive. They can work together. There is not easy rule of thumb in that relationship. Economies of scale must be optimized as well as economies of scope optimized. The total benefit from optimizing multiple outputs is not a foregone benefit. However, if multiple outputs are not optimized together (products and byproducts) there will be no opportunity for additional revenue.
Thank you Scott Irwin and the US Dry Mill Ethanol Industry for broadening our understanding of multi-product output!
Comments
Ethanol Production Optimizes Outputs – University of Illinois — No Comments
HTML tags allowed in your comment: <a href="" title=""> <abbr title=""> <acronym title=""> <b> <blockquote cite=""> <cite> <code> <del datetime=""> <em> <i> <q cite=""> <s> <strike> <strong>