Characterizing US Farms by State with Median and Average Values
US farms are very diverse but are easy to group into a common label. The 1.9 million farms counted by USDA, National Agricultural Statistics Service (NASS) for 2023, are all authentically US farms. The average number of farms per state results in 37,899 farms per each of 50 states. The average farm size in the US is 464 acres per farm. These numbers can have value, but taking the ‘average’ of sample with such wide variations has limited meaning. Does the value of 37,899 farms represent your state? Does 464 acres per farm represent the farm sizes in your area? An alternative to the average farm is the median farm.
The USDA, Economic Research Service (ERS) reports farm income in both median and average farm values. Before examining those farm income values, it is useful to unpack the implications of these two ways to summarize things like aggregate farm data.
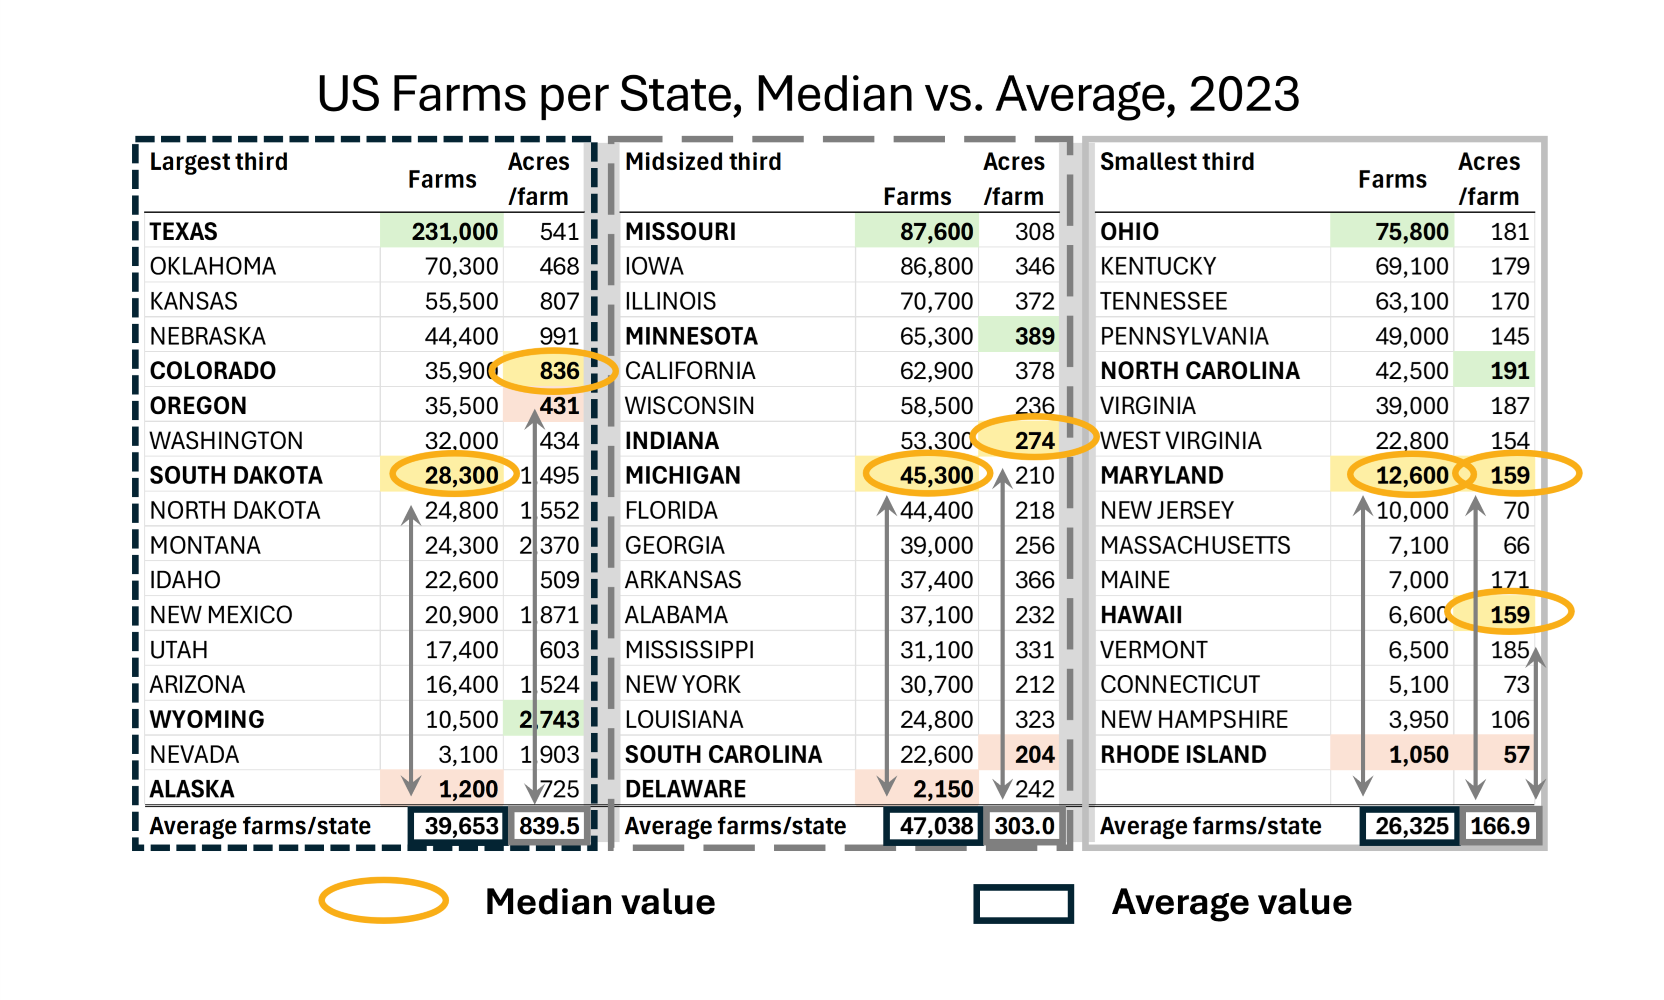
Today’s table of farms by state is in three columns. The 50 states were sorted into thirds by declining average farm size in acres per farm for each state. This worked out to two groups of 17 states and one group of 16 states.
- Visually scanning the state average of acres per farm values, the first group on the left are all larger than the states in the other two columns.
- The states in the column on the right have the smallest 16 state average acres per farm values.
- The middle column has 17 states with average state farm sizes between those of the other two columns.
After the states were sorted into size by average acres per farm, they were resorted in descending order of number of farms within each state. Texas is huge with 254 counties within its state boundaries. It makes sense that it has the largest number of 231,000 farms in the state. The average farm size is 541 acres per farm. Rhode Island, likewise, is physically very small with 1,050 farms and a state average of 57 acres per farm. Even when aggregated by state, US farm as very diverse.
Average Values
Those are the boundaries of this data. The fifty US states are familiar. These two metrics, farm number and farm size in acres per farm by state are also intuitive. Curiously, these three groups are relatively evenly distributed in farm numbers. The group of states with the largest acres per farm have an average farm number of 39,653. These 17 states represent 36 percent of the 1.9 million farms. The midsized 17 states represent 42 percent of US farms with an average of 47,038 farms per state. The 16 states on the right represent 26 percent of US farms, with an average of 26,325. Here is a weird thing. The similarity of these percentages of US farms to the respective average farms in each state is a total coincidence.
The averages of acres per farm at the bottom of each of the three columns affirm the definition of the three categories by acres per farm in descending order. The averages from left to right are 839.5 acres per farm, 303 acres per farm, and 166.9 acres per farm. Aggregating out the largest western states based on the relatively arbitrary measure of acres per farm, brings an interesting homogeneity to the underlying nature of US farms.
Maximum, Median, and Minimum Values
Because the farm numbers are sorted in descending order, the maximum number is at the top, the minimum number is at the bottom and the median number is in the middle, whereby definition it should be. The maximum, minimum, and median of the acres per farm value are ordered by the farm numbers in each state, so not as intuitive as the farm number order.
For our purposes, the median of the acres per farm values is treated as the mid value in descending order. The median values for both parameters are shaded in yellow. The maximums are shaded in green and the minimums in red. It is an intuitive, green, yellow, and red scheme for highest to lowest without inference to size preference.
Average versus Median
In this example dataset, there is not a lot of difference between the average farm values by state and the median farm values by state. This is more of a validation of the principles of the Central Limit Theorem than a flaw. The largest difference between the state average farm values and the median values is with the farm number per state of the largest states in the first column. South Dakota has a median value of 28,300 farms per state. The average farm number for these 17 states is 39,653 farms per state. The average is nearly 50 percent larger than the median.
Texas has 231,000 farms per state. Alaska has 1,200 farms per state. This range is enormous. Oklahoma is the state in this category with the second largest number of farms, 70,300. This is smaller than one third of the size of the largest state, Texas. More states in this group are better represented by the median, 28,300 farms, than by the average of 39,653 farms.
US farm incomes are similarly skewed. Therefore USDA, ERS leans toward the median farm income than average farm income. ERS presents both numbers. But the median farm income values generally represent more farms than the average farm income values.
The measure selected to summarize farm numbers matters. It also requires data users to be familiar with implications of each summary measure. One of the more interesting outcomes of this blog is how homogenizing it is to group the 50 US states by descending average acres per farm. This framework will find other uses.


Comments
Characterizing US Farms by State with Median and Average Values — No Comments
HTML tags allowed in your comment: <a href="" title=""> <abbr title=""> <acronym title=""> <b> <blockquote cite=""> <cite> <code> <del datetime=""> <em> <i> <q cite=""> <s> <strike> <strong>