Calculating Annualized Inflation with Rate of Growth – What the Function
The last few years have been an inflationary roller coaster. On September 26, nearly 50 years of US inflation was used to illustrate HOW NOT TO USE inflation (spurious correlation). Part of understanding what charts of inflation actually mean, is understanding how they are generated.
The base calculation is a simple growth rate equation. When the change between two time periods, from one period to another period, is evaluated this basic growth rate is the relationship. Note: there are many, kinds of growth rate formula, including the exponential trend used in Midwest Land Prices Only Increase in the LONG View and the time value of money compounding rate described in Long-Run Illinois Land Value – What the Function.
Growth Rate = (Value, most recent period – Value, from earlier period) / Value, from earlier period x 100.
- Equations are about relationships. Subtracting the most recent value from an earlier value provides a measure of change. When the most recent or current value is greater than the earlier value, the numerator will be positive and represent growth. But if the most recent value is lower, it just means the numerator will be negative and growth will be negative also.
- Dividing the measure of change, numerator, by the earlier value gives a change relative to the earlier value. Most fractions indicate the value of the numerator in relationship to the denominator. Math is often intimidating, but it is really shorthand for words.
- The last bit is multiplying the decimal values by 100. This step coverts the growth measure from a decimal, 0.00081 to a percent 0.081%. It is important to realize these values are the same amount, even though the numeric values look different.
Growth of Prices, Inflation, Using the Consumer Price Index (CPI). The calculation of inflation often seen in the news is not difficult but is not easy to find instructions. Here they are!
- Getting the data. The Consumer Price Index is curated for the U.S. Economy through the Bureau of Labor and Statistics (BLS). There is more than one variation of the CPI, but the one most commonly used as a baseline is the unchained, urban city (CPI-U) index. The term chained indicates the prices have been seasonally adjusted. Certain products and services have seasons, and when looking at that part of the economy, seasonally adjusted, or chained CPI is valuable. There are also regional CPI’s, but the CPI-U represents the US price levels well. A reliable source of CPI-U data can be downloaded by clicking the database link on the bullet – Historical CPI-U, August 2024 (database) (PDF).
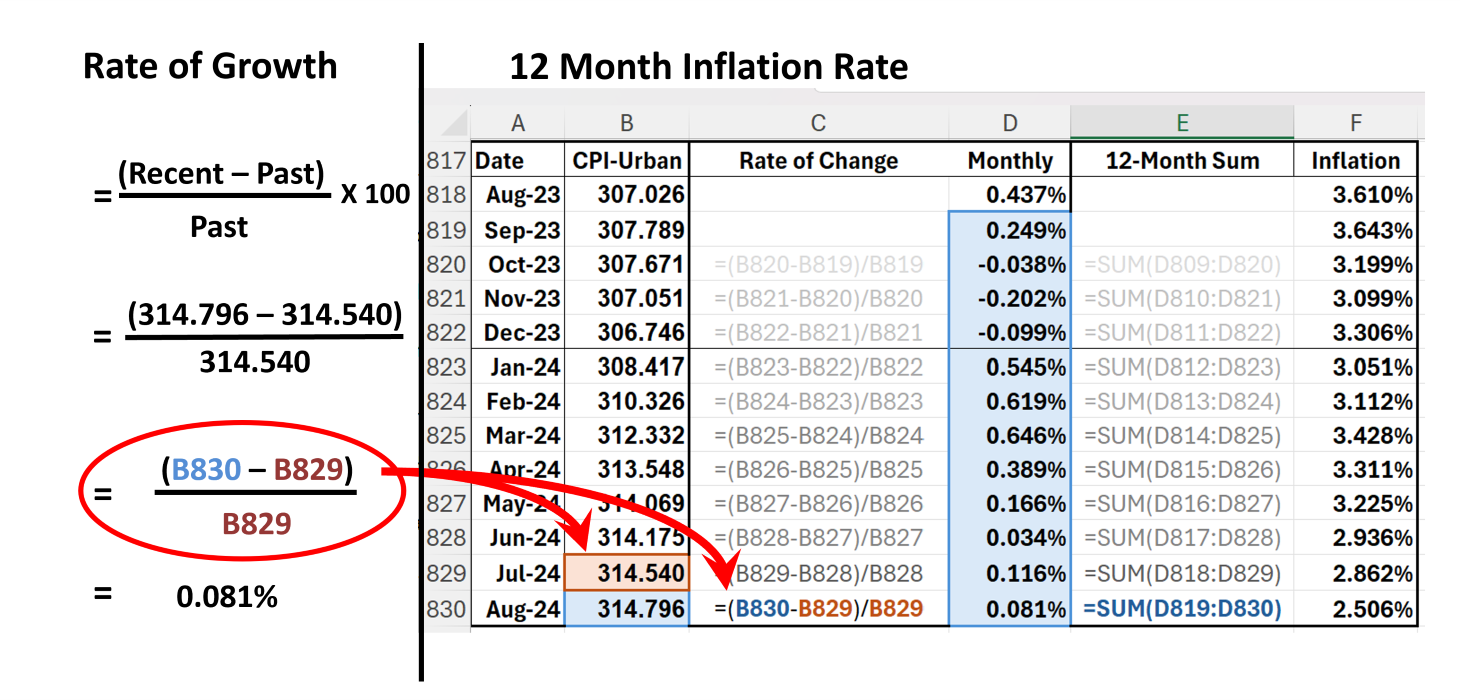
- With the monthly dates in Column A and the monthly CPI-U values in Column B of the spreadsheet, enter the growth equation in the row with the most recent CPI-U value in it. In the example spreadsheet, this is Row 830. The relationships to calculate a one-month change works the following way,
-
-
- (CPI, August 2024 – CPI, July 2024) / CPI, July 2024 x 100
- (314.796 – 314.540) / 314.540 x 100
- (B830-B829) / B829 x 100
- 0.00081 x 100 = 0.081%
-
- Sum 12, monthly growth rates for an annualized inflation rate. This is an annual rate, but it isn’t called that because it is a rolling 12-month rate, rather than one that ends in the calendar year. In Forecasting a Plague with Moving Averages the daily new COVID cases were averaged every 7 days. This annualized inflation rate is a moving sum. It works the same way but the 12-month sums move.
This graphic illustrates the formula for the monthly rate of change and the 12-month, rolling annualized rate for August 2024 in Row 830. The formula in Column C are what is the live formula in Column D. The SUM() function in E830 is actually the underlying formula in Column F. Summing cells D819 to D830 gives the value 2.506%.
The beauty of spreadsheet work is that when the formula are correct in one row, it is easy to copy it to the rest of the table. The ease of copying formula is also the greatest risk in spreadsheet work. If the formula is not correct, it is very easy to copy the incorrect formula all over with the incorrect information. Over time, successful spreadsheet operators learn to build in lots of validation techniques.


Comments
Calculating Annualized Inflation with Rate of Growth – What the Function — No Comments
HTML tags allowed in your comment: <a href="" title=""> <abbr title=""> <acronym title=""> <b> <blockquote cite=""> <cite> <code> <del datetime=""> <em> <i> <q cite=""> <s> <strike> <strong>