The Incorrect Use of a Mean to Mean a Midpoint is Just Mean
English is so difficult. The word ‘mean’ here has three different meanings, one of which is to understand.
- The first occurrence of ‘mean’ infers an average.
- The second ‘mean’ occurrence implies or conveys understanding.
- The third ‘mean’ is a value judgement (bad).
What’s the point? Vigilance requires us to stay alert! Multiple definitions lead to a lack of clarity in economics and economic policy.
Theoretical models shape our world. Taking the average, or mean, of a group of numbers provides economic and operational stability that is often hidden. It is the continuity of the Central Limit Theorem in our lives that facilitated its formulation. Theoretical mathematics states that the random universe is defined by data presented in distributions. A common and powerful distribution is the normal distribution described as a bell-shaped curve. This normal distribution is defined as:
f(z) = (1/√2π) * exp ((-1/2)*z2)
Cool, huh? But for conversational purposes, the peak in the bell-shaped curve is the mean, or average. Adding up all the values in a sample and dividing them by the number of samples gives a numeric value to the arithmetic mean. The peak of the distribution is not always normal. But it occurs frequently, and we culturally get by safely starting with an assumption that the event we are observing has a normal distribution. The mean carries useful information without having to derive statistical formulas.
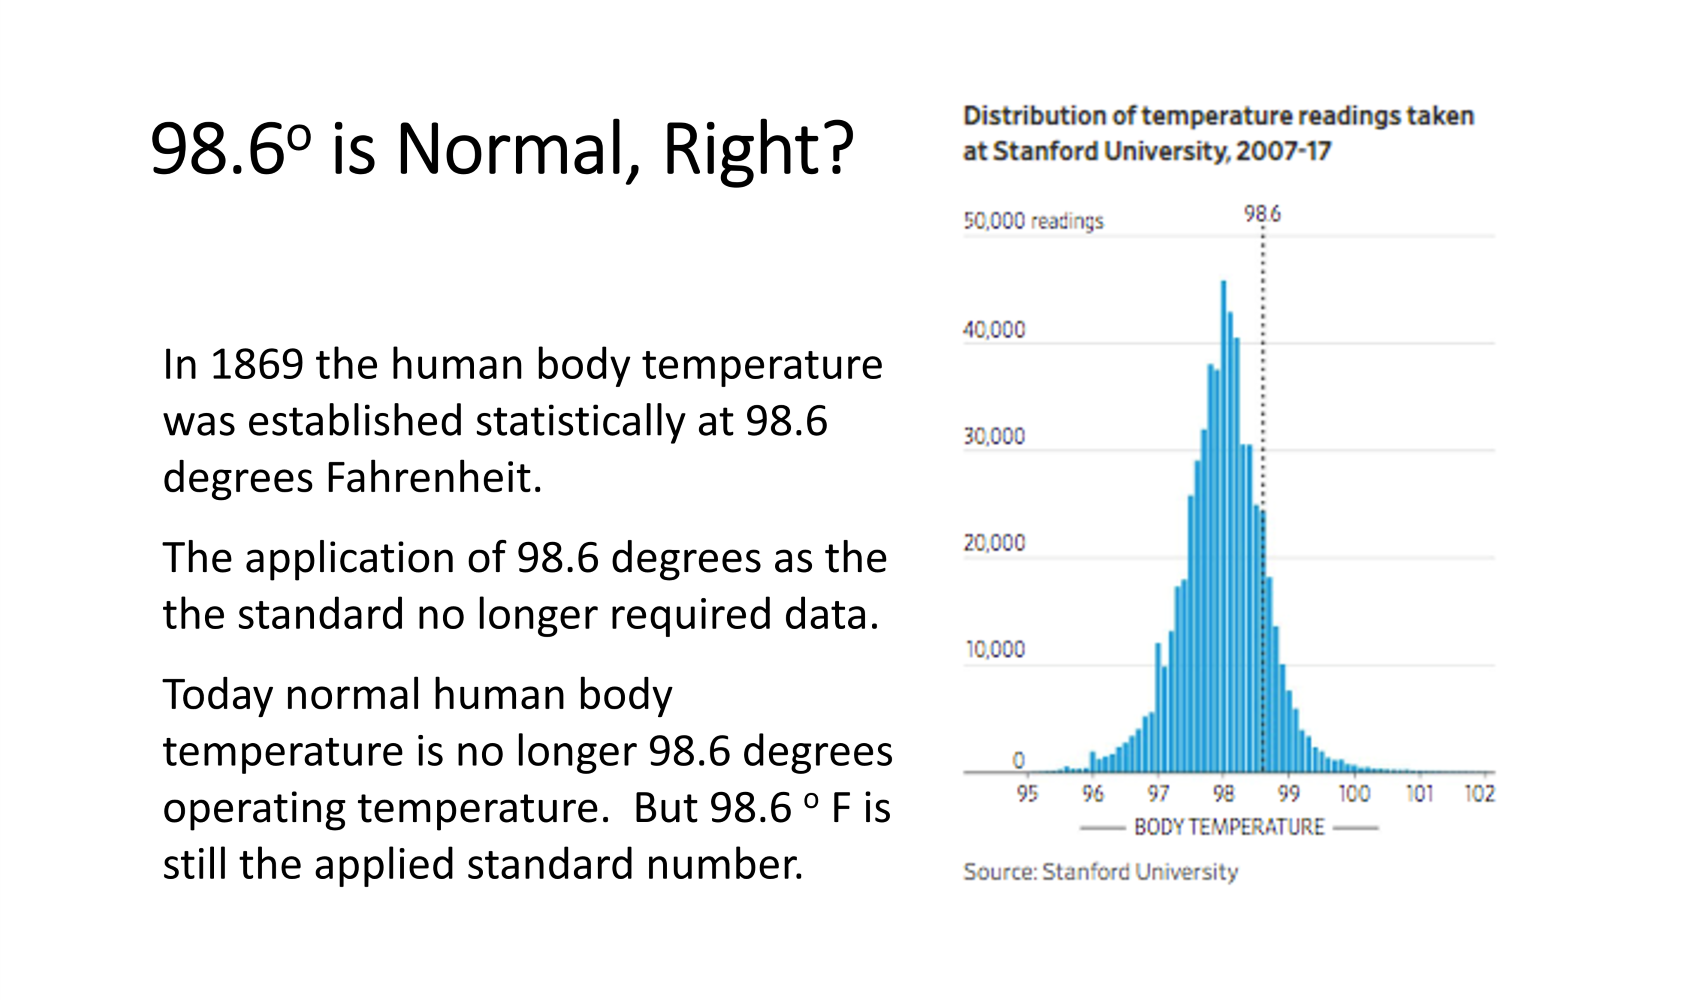
The graphic today is from a January 17, 2020 Wall Street Journal (WSJ) article on the relatively common knowledge that these days, the human body normal temperature is not 98.6 degrees Fahrenheit. It works nicely for this discussion. The bell-shaped, normal distribution of the Stanford study discussed on normal body temperatures is clear. The difficulty is that the Stanford mean is 97.5 degrees, not the 98.6 degrees that statistics defined it as in 1869.
We can show consistently in replicated experiments that the normal human body temperature is not 98.6, but we still use the earlier mean as our standard. Unfortunately, this happens quite often. We take historical data to develop trends and forecasts about a future that is different than it was when the historical data was collected. It is building a pathway forward from data collected looking backwards. This works well if one is paying attention. But if technologies are erupting rapidly like the evolution of the gig economy where employment is not counted the same way as before, or the development of artificial intelligence (AI), or bitcoin, the forecasts and policy decisions no longer provide accurate answers.
The mean is not the same analytical tool that we use in forecasting. But the same thing happens in forecasting. Regression is more of a linear average than a point average. The challenge is that the theory is brilliant. It is the data that gets entered into the theory that creates misleading answers.
Then there is the more difficult problem of the body temperature standard temperature. Here the entire culture maintains the 150-year-old standard, even when new information is provided. The truth is not as compelling as our practice.
This article came out in January of 2020. The first memory I have of COVID-19 was in the third week of January 2020, when I had a student in my rural Illinois economics class from Wuhan, China who missed the first few days of class due to illness. By January, the world was watching the pandemic evolve. It wasn’t until March 2020 that the United States went into partial lockdown. But what happened? Did the knowledge that our normal human body temperature was a degree lower cause a significant problem? It did not. Our medical profession long ago adapted to body temperatures. They are indicators. When our bodies go up a few degrees, over 100 degrees, it indicates something is not normal.
It makes a great illustration of
- The normal probability distribution, bell shaped curve
- The arithmetic mean at the peak of the curve
- And how the application of the mean may not change, even when the data illustrates that it has changed.
- Frequently, it is the data that changes the outcome, not the need for new updated theories. Although that is always occurring.
This post’s image was part of my second day of undergraduate economics, entitled, “Art Appreciation Day.” It was a graphic introduction to models and applied statistics. All pointing to the need to pay attention and think critically every day.
USDA, Economic Research Service (ERS) prefers the inference of the measure of the median rather than the average, when describing the universe of farms and their incomes. There is a reason for this. Mostly the farm income distributions are not normal. And while there is still a mean, it may be less representative of the most common farm income level than the average. In this case, the median can provide a better picture of what is most common. That lesson is for another day.
Trying to get three definitions of the word, mean, into a single title was a bit of a stretch. A more direct meaning would be, “The use of outdated means as a current standard is misleading.” We are surrounded by random data in normal distributions that authentically are represented by a simple average. Like every analytical tool, we can trust them too much and miss what is really happening. So, think critically and pay attention!


Comments
The Incorrect Use of a Mean to Mean a Midpoint is Just Mean — No Comments
HTML tags allowed in your comment: <a href="" title=""> <abbr title=""> <acronym title=""> <b> <blockquote cite=""> <cite> <code> <del datetime=""> <em> <i> <q cite=""> <s> <strike> <strong>