The 2022 Farm Economy – A Snapshot in Time
Fifty years ago, in 1974, the definition of a U.S. farm for the purposes of collecting data in the Census of Agriculture, was set at $1,000 of farm value of production. This includes gross sales or potential sales. The Ag Census is collected every five years, in years ending in either a ‘2,’ or a ‘7.’
The census data captures a clear snapshot of farm production for the nation all the way down to the county level. Census users are used to the stability of finding the same data that was available in the previous census in the same place in the next version of the census. Data stability is a priority of census administrators.
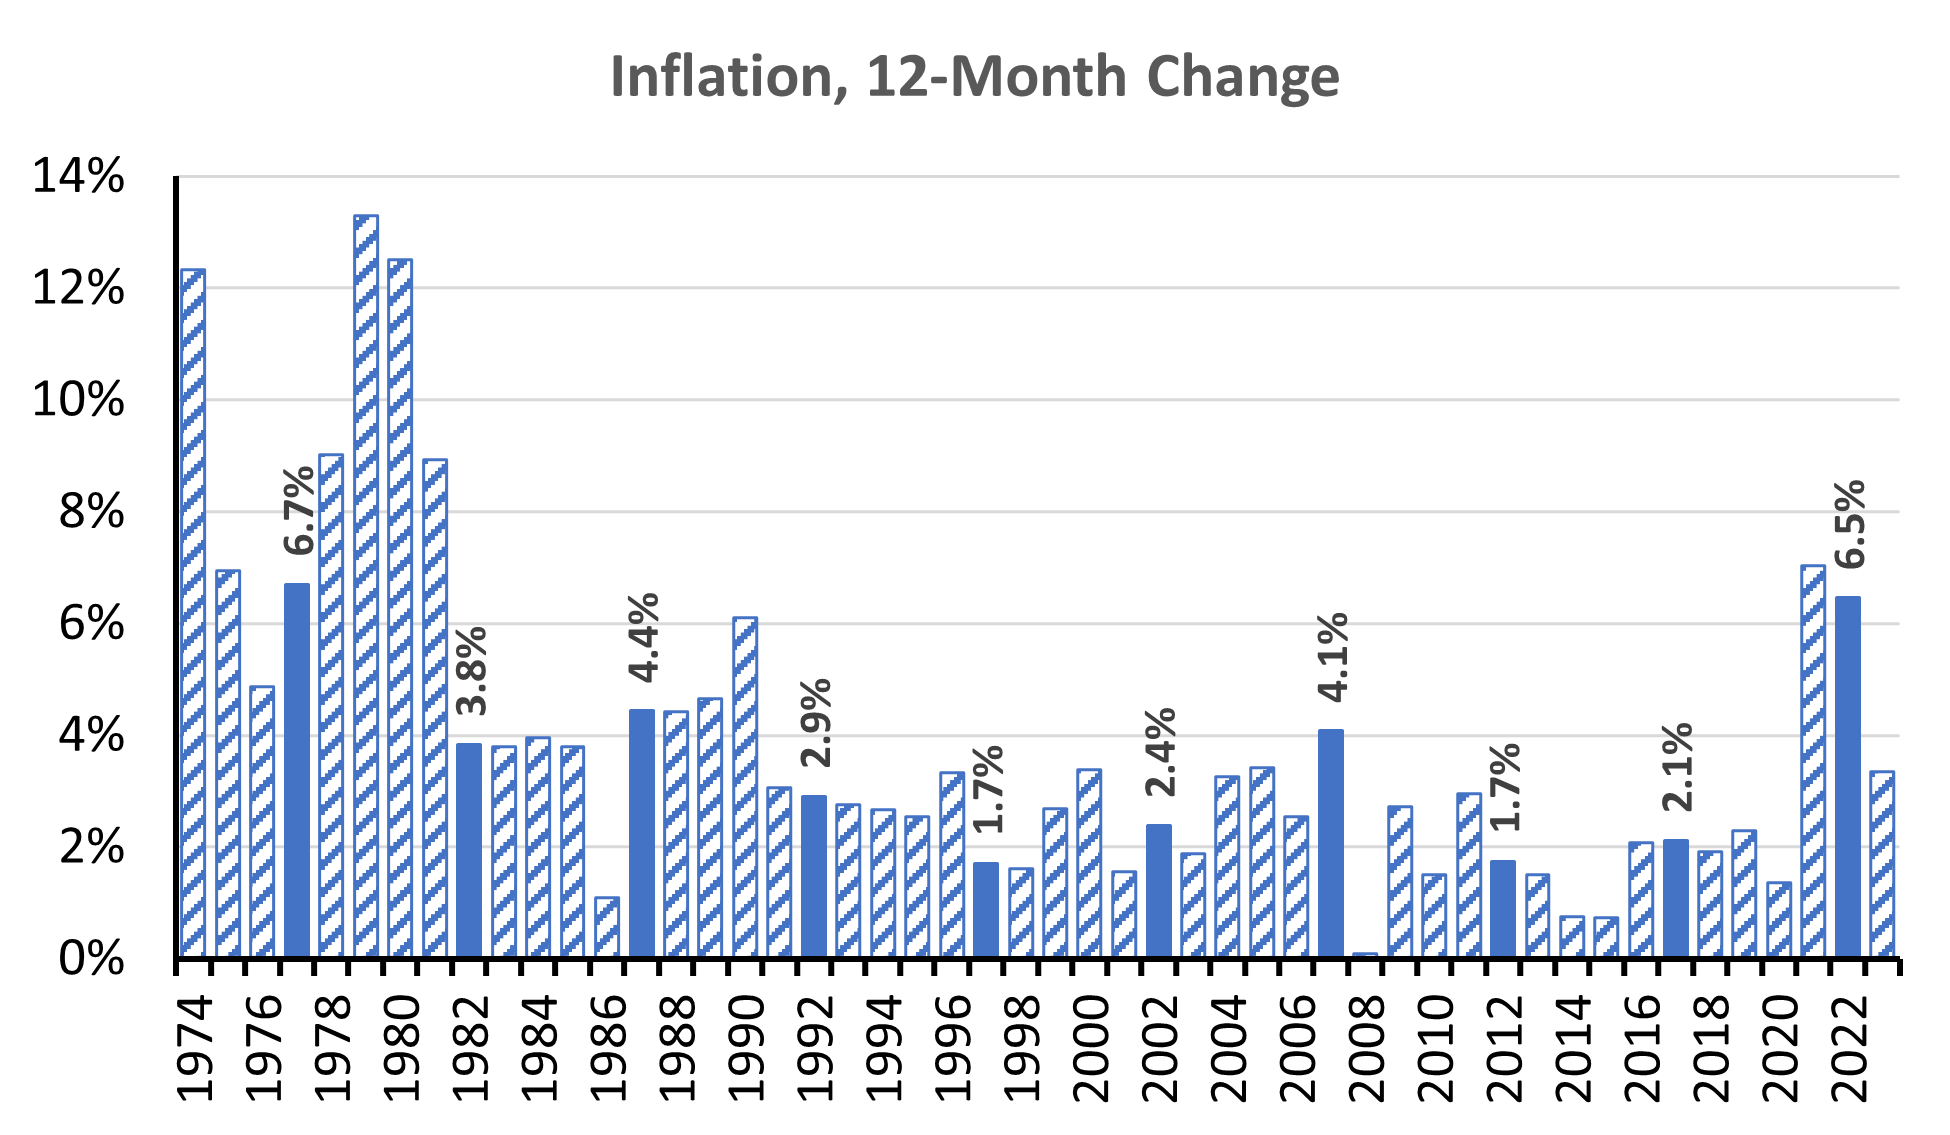
Sale prices and farm expenses are the values reported by farmers, without adjusting for inflation. The U.S. economy recently navigated a period of high inflation, and since the farming sector is part of that, it seemed the 2022 Census data would reflect that high inflation period. This chart illustrates an annualized, 12-month window of inflation for each year back to 1974. These 12-month inflation values were calculated based on a calendar year with the December CPI value (Consumer Price Index) as the ending month.
The 1977 Census of Agriculture occurred in a season of high inflation. The Census year at that time reflected a 12-month period of inflation of 6.7 percent. This is the highest inflation rate in the 50-year period since the farm definition was set in 1974. Yet for that period, the census collection year inflation rate of 6.7 percent was low.
As we have seen in other charts in the last few years, the most recent high inflation was the most dramatic inflation in 40 years. The annualized inflation for 2022 was as high as the 1977 annualized inflation rate.
But what is as compelling as the inflation rate for the years in which the Census of Agriculture was taken, is the inflation activity between the census collection years. There were peaks of high inflation on both sides of the 1977 Census of Agriculture. The level of inflation surrounding the 2012 and 2017 Census of Agriculture were also uncommonly low.
Inflation is only one measure of economic activity shaping the farm economy, but it does influence farm production decisions. As we search the new 2022 Census of Agriculture for the latest new trends, it is important to remember that external economic forces are at play influencing the accurate data within the census that may not be apparent without additional context. Pay attention to the underlying context, in addition to enjoying this great dataset on U.S. farm productivity in 2022.


Comments
The 2022 Farm Economy – A Snapshot in Time — No Comments
HTML tags allowed in your comment: <a href="" title=""> <abbr title=""> <acronym title=""> <b> <blockquote cite=""> <cite> <code> <del datetime=""> <em> <i> <q cite=""> <s> <strike> <strong>