Deriving Real Values for AFBF’s Thanksgiving Survey – What The Function
The American Farm Bureau Federation does an excellent job with the annual Thanksgiving Meal Survey, and they have for nearly 40 years. They have the infrastructure and the expertise to make it work every year. All of their prices are authentic. But the economic term for deflating a price series is ‘real’. Using the easy-to-collect current prices embeds the noise, or inflation, of rising prices in the series. By removing the inflationary noise, the prices become real and deflated. This is done by setting the price levels to a given year, in this case to 1986 levels.
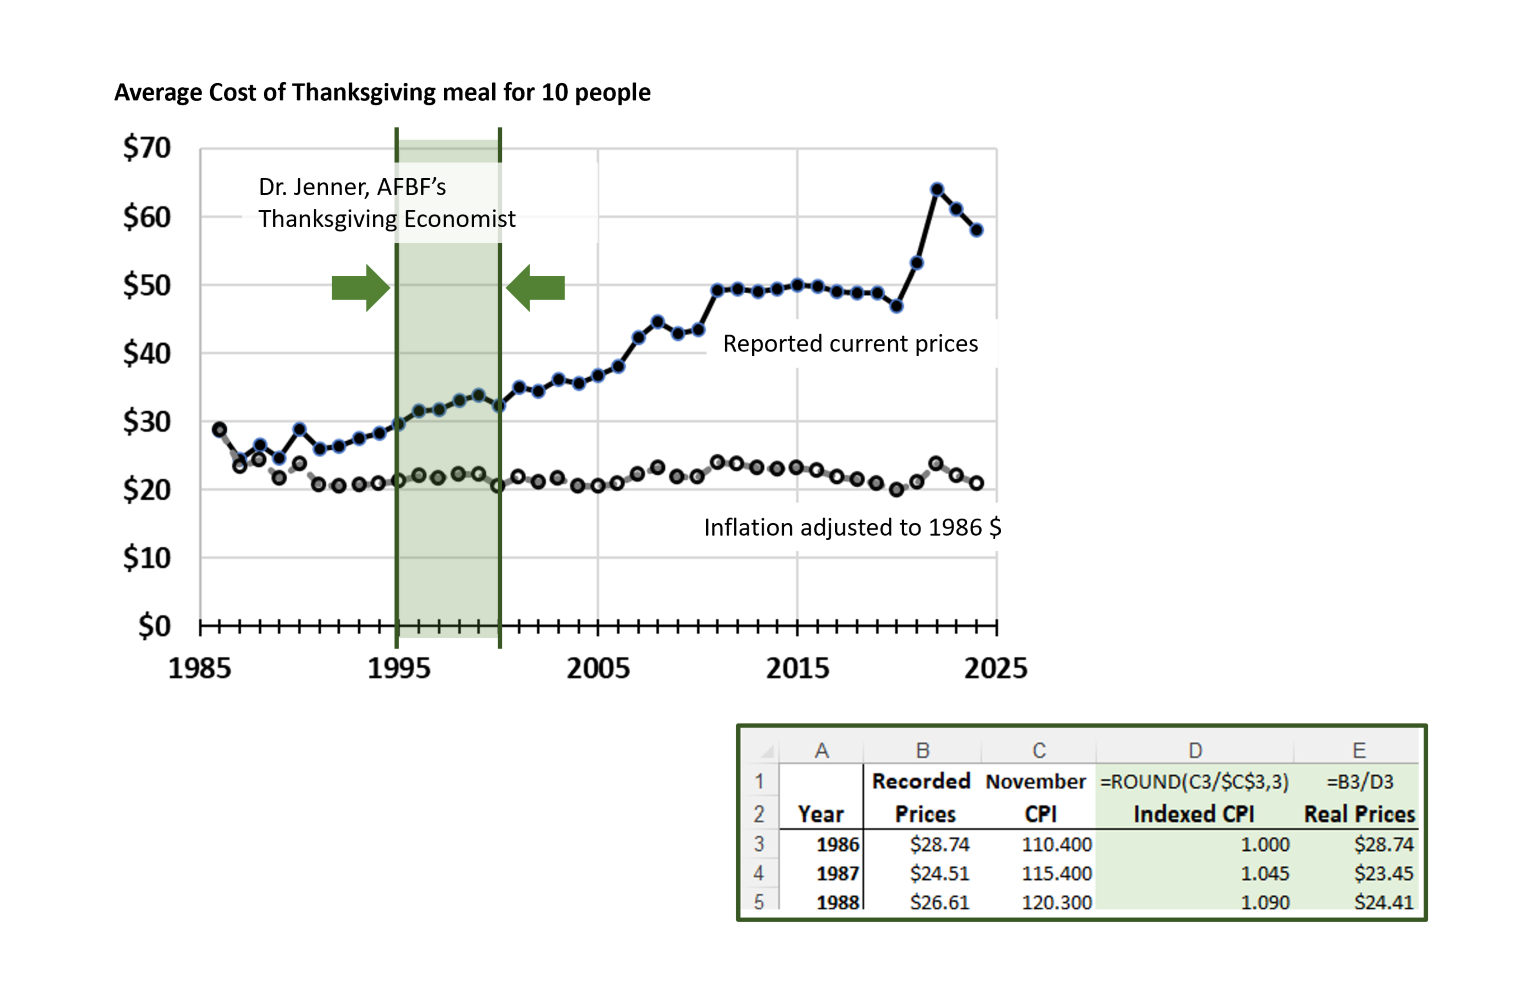
The most fascinating thing about this chart of 39 years Thanksgiving grocery store prices, is that when the Thanksgiving meal prices are deflated, the real price of the 10-person, American Farm Bureau Federation, Thanksgiving Meal Survey, IS THE SAME AS IT WAS IN THE 1980’s. As costs have increased in processing food over the years, competition for retaining grocery store customers has driven retailers to find ways to offset those cost increases for their customers. Without the economic noise of inflation, the cost of feeding 10 people at Thanksgiving in the United States, has barely changed in 4 decades.
The decade following the 2008-2009 recession, inflation was low. This tremendous economic success exaggerated the shock of rapid inflation after the pandemic. But using 1986 dollars, the cost of this traditional meal has averaged about $21 for 39 years.
AFBF provides this chart in their annual news release. It is a great addition to the story. Biomass Rules used the November CPI back to 1986. We also pulled the Food CPI values for November each year and the results were indistinguishable from each other. The values presented represent the November CPI for each year.
US Consumer Price Index (CPI) values are provided by the Bureau of Labor and Statistics. But it is easier to pull ready to use time-series CPI data from grabbing them from the St. Louis Federal Research, Federal Reserve Economic Data (FRED) website. By going to this link and clicking the DOWNLOAD button just above the chart on the right side, a dropdown menu opens. Select Excel (data), and nearly 80 years of CPI data are ready to go. Well, it pulls monthly data for all those years. This chart only uses the November CPI from each year.
The three lines of the spreadsheet represent only the first three years of the Farm Bureau survey. Column B is the annual survey prices reported by AFBF. Column C is the November CPI value.
It is worth recalling that the US CPI values are set to 100 = 1982 to 1984 prices. I have told some that Dr. Jenner was out of the country in Nepal in those years, so the economy was stable. But in November 1986, the CPI was 110.400. It was only 10.400 points above the baseline of 100.
In this series, another index is created setting all years to the reference November 1986 CPI value. Effectively, each November CPI is divided by the November 1986 CPI. The first record for 1986 divides the November 1986 CPI by the November 1986 CPI and returns the expected 1.000 index value. Row 3 is the first-row of 1986 values. The formula for Row 3 (1986) is above the column heading in Column D. =ROUND(C3/$C$3, 3)
The ROUND() function sets the decimal places at three. The right most “3” after the last comma conveys that information. The first fraction in front of that comma, is Cell C3 divided by Cell C3. But the ‘$’ is the spatial anchor. Because in this case there is a $ sign in front of both the Column and the Row, $C$3, that denominator will not move when copied. Each subsequent row will change the numerator to reflect the current year, while the denominator will always point back to the 1986 November CPI in Cell C3.
The next step is to divide the original recorded meal price each year (Column B) by the new indexed CPI values in Column D. =B3/D3 (no $ here).
Once the first row is coded correctly, copy the formula in Columns D and E down to the bottom of the column. Now you have 39 years of real prices in 1986 dollars.
When the AFBF annual Thanksgiving Meal Survey came up in my undergraduate classes each November – and it did – students in my classroom all heard that Dr. Jenner had a season as the AFBF Thanksgiving Meal economist. After all these years, it is still a privilege. I was asked recently how this survey has changed in the last 25 years. Three things that have changed are:
- Food is more important to our culture post-pandemic than it was before. So folks want to know more about food and food inflation.
- The Farm Bureau network gets better at collecting the best data every year.
- AFBF gets better at telling the really great story for farmers every year.
Back in the early years, when I was the AFBF Thanksgiving economist, for example, we did not deflate prices over the years to provide a comparison of real prices as they do today. Well done, US farmers, manufacturers, distributors, and retailers! Having lived in areas where food was not as readily available, I am grateful for the access we have to food in the United States.


Comments
Deriving Real Values for AFBF’s Thanksgiving Survey – What The Function — No Comments
HTML tags allowed in your comment: <a href="" title=""> <abbr title=""> <acronym title=""> <b> <blockquote cite=""> <cite> <code> <del datetime=""> <em> <i> <q cite=""> <s> <strike> <strong>