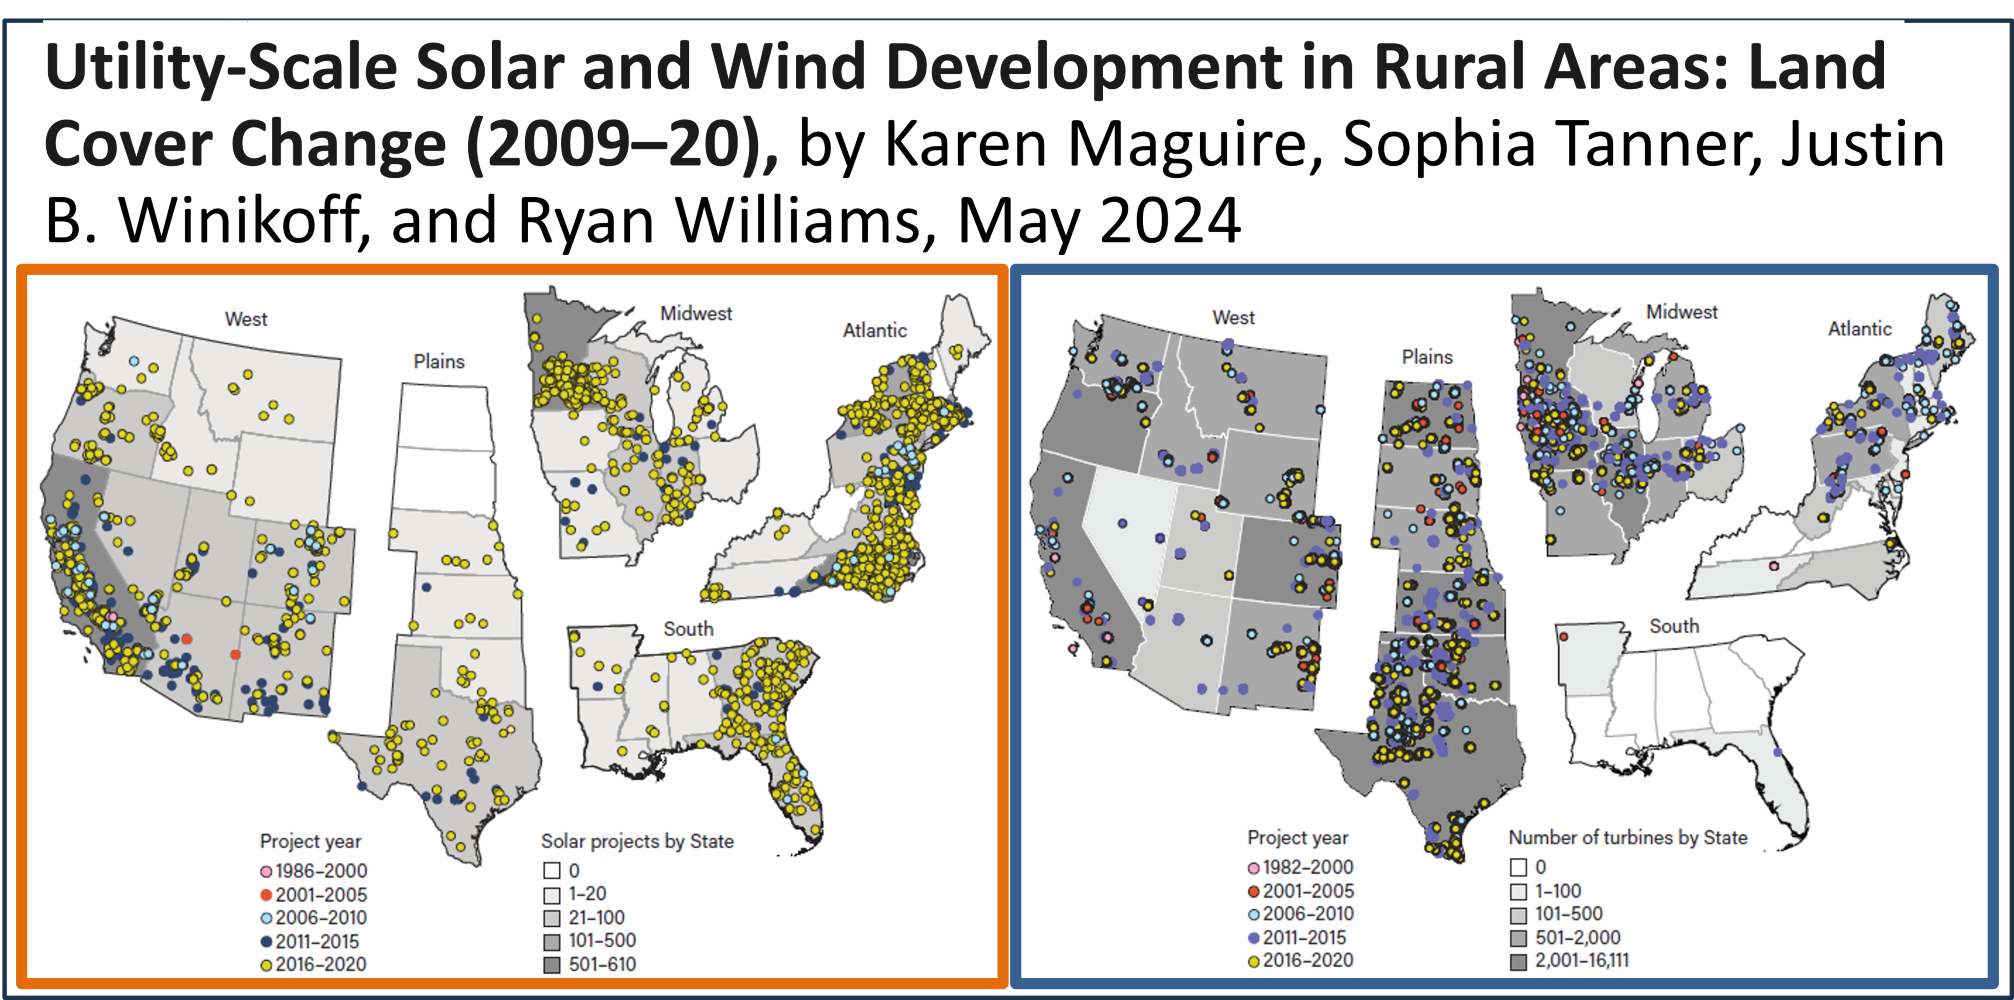
Utility-Scale Solar and Wind Development in Rural Areas: Land Cover Change (2009–20)
Karen Maguire, Sophia J. Tanner, Justin B. Winikoff, and Ryan Williams
USDA, Economic Research Service, May 2024
The following findings were reported in this interesting report.
This study examines land cover surrounding rural solar and wind installation sites from 2009–20. It explores regional patterns in the distribution of land cover and estimates the amount of land directly affected by development.
Finally, the report examines land cover changes associated with solar and wind projects.
- In rural areas, in 2020, the footprint, or land area directly affected by solar or wind farms, is small relative to the approximately 897 million acres of land in farms. The estimated footprint for solar and wind farms was 336,000 acres and 88,000 acres, respectively.
Land cover prior to solar and wind farm development:
- Most solar farms were installed on land that was in cropland (43 percent) or pasture-rangeland (21 percent) prior to development.
- Wind turbines were predominantly installed on land that was classified as cropland (56 percent) and pasture-rangeland (36 percent).
- Solar projects were more commonly installed on nonagricultural land (17 percent) than wind turbines (3 percent).
- In the Midwest, 66 percent of solar farm sites were characterized as cropland prior to installation. In the Plains and the West, most solar sites were pasture-rangeland (60 percent and 51 percent, respectively).
- In the Midwest, 93 percent of wind turbine sites were classified as cropland prior to installation. In the Plains, 45 percent of turbine sites were pasture-rangeland, and in the West, 65 percent.
Average annual rate of land cover change on land used for a solar or wind installation site:
• On average, 16 percent of all solar sites experienced a year-to-year land cover change. For turbine sites, the share was 4 percent.
• The average annual rate of land cover change was largely unchanged after solar and wind development.
Land cover change in proximity to a solar or wind development, from 3 years before to 3 years after installation:
- Land cover changed at 26 percent of solar sites but only 5 percent of wind sites. Fifteen percent of solar sites shifted out of agriculture after installation; for wind, it was less than 1 percent.
- Typically, solar sites that were categorized as cropland prior to installation remained in the same land cover category after installation (82 percent). For wind turbines, the share was 99 percent.
- Seventy-three percent of solar sites and 92 percent of wind turbine sites that were categorized as pasture-range prior to development maintained the same land cover category after development.
- For sites categorized as continuous cropland prior to installation, a higher share of solar sites (36 percent)


Comments
Utility-Scale Solar and Wind Development in Rural Areas: Land Cover Change (2009–20) — No Comments
HTML tags allowed in your comment: <a href="" title=""> <abbr title=""> <acronym title=""> <b> <blockquote cite=""> <cite> <code> <del datetime=""> <em> <i> <q cite=""> <s> <strike> <strong>