The More and Less of US Energy Consumption
Biomass Rules seeks out examples of increased efficiency and utilization. This means businesses and economies produce more output from fewer inputs. We have focused our work in research and innovation the last four decades on either developing an innovation, or documenting an innovation. The shorthand for this is getting more from less. The US is among the best economies at consuming everything. But the US is also the best at reducing input requirements just as well. This post looks at shifts in the output of GDP and Greenhouse gas (GHG) emissions, as population has increased and energy consumption has decreased.
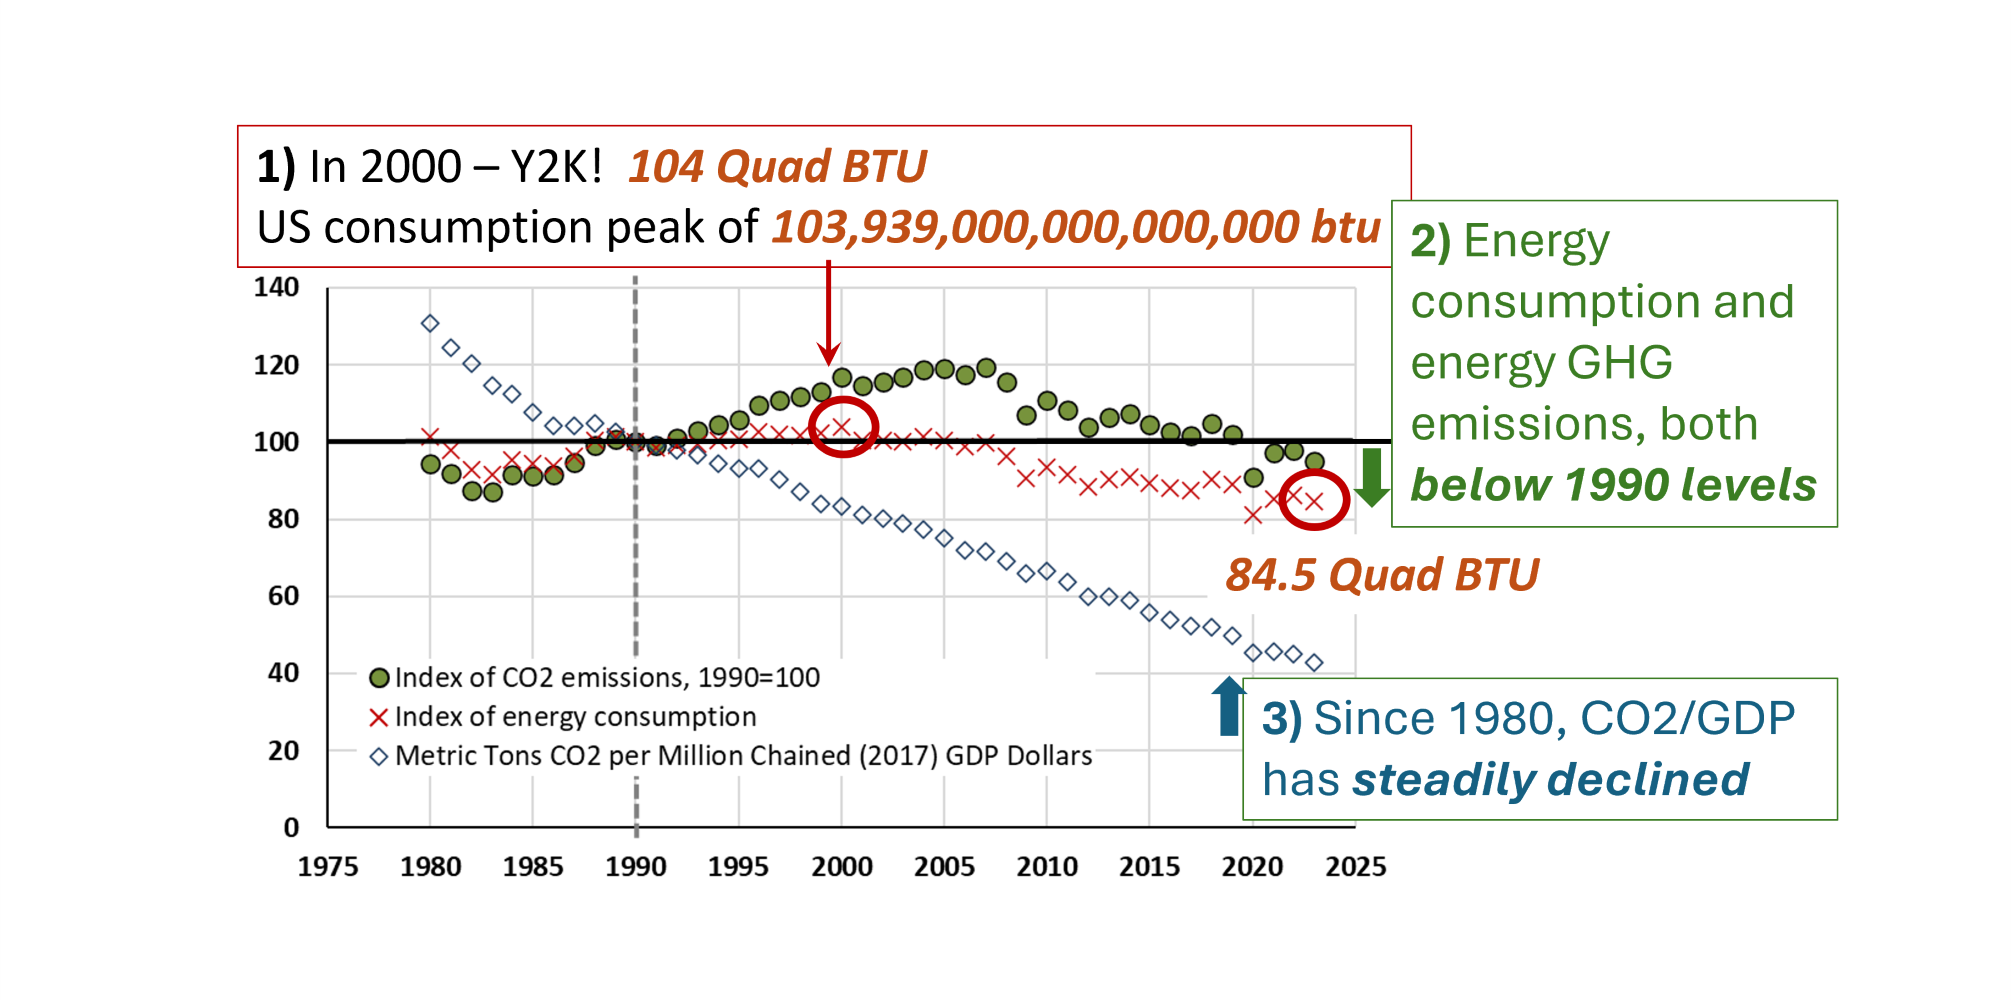
US Energy Consumption has Peaked in 2000. The growth of US energy consumption grew steadily for decades until the year 2000. Then consumption peaked and began to decline. US energy peak consumption in 2000, 104 quadrillion btu, or 104 quad btu. Millions and billions are large number. Trillions and quadrillions are even larger. The number 1 quadrillion is a 1, with 15 zeroes behind it, 1,000,000,000,000,000. 100 quad is two more zeros. Even more crazy is that 1 percent of 100 quad is still a number so large it is followed by 15 zeroes. 1 quad is also 1 billion x 1 million. It is a huge number.
In 2023, the Department of Energy reports the US consumed 84.5 quad btu. In the first 23 years of this century, US energy consumption dropped by nearly 20 percent. In the meantime, the US population continues to grow. Even as more energy users accumulate, the US is reducing its energy consumption.
US Energy-Related GHG Emissions Dropped Below 1990 Levels. Over 80 percent of US GHG emissions are from energy use. This chart includes the reduction of energy-use related GHG emissions in the US since 1990. The target for the last 3 decades has been to return to or go lower than 1990 emissions. We have done it in energy-derived emissions for the last 4 years. This data mirrors the data presented in the 2024 US EPA, Greenhouse Gas Inventory Report released in April that we have succeed economy-wide emitting less than 1990 in 2020 (Figure ES-15 in the Executive Summary).
So, the population of energy consumers is increasing while energy use and GHG emissions are declining. The first two data series are total annual output. They are indexed by the 1990 values. All the reported data in quad btu and million metric tons were divided by the 1990 values and multiplied by 100. The 1990 values = 100. This allows comparison of incremental changes on an index relative to what was happening in 1990. Values above the 100 benchmark are larger than in 1990. Those values that are below the 100 benchmark line are below the 1990 values.
US CO2 Output Per Unit of GDP is Steadily Declining. The last series looks at GHG emissions per unit of GDP, output of the US economy. Here it gets a bit complex. The Gross Domestic Product (GDP) is the economic output measured in dollars. But in this ratio of GHG emissions per GDP, the GDP is also a unit of input into GHG production. This works like miles per gallon, or yield per acre, where miles and yield are outputs and gallon and acre are inputs. Output per unit of input.
Inflation adjusted output, or Real GDP continues to grow over decades in the United States. The Dept. of Energy reported the GDP values in 2017 dollars, it indicates the GDP values in this example have been adjusted to the value of the GDP in 2017. This is how we measure progress. When a recession occurs, that growth takes a break and declines (for at least 2 consecutive quarters). This is more significant now because for the last 15 years we have had 1) generally increasing GDP, while 2) the GHG emissions have been decreasing. This shows up in the ratio of GHG emissions per unit of GDP.
The US has been more productive with more people living in the United States, and still we are emitting fewer emissions that we did in 1990. Pretty exciting!
Assessing these gains are more complicated than looking at the change of one economic indicator over time (like GDP, inflation, and prices). But just because they are not presented every day, does not mean they are not happening! If a tree falls in the forest does it make any sound. Of course. We need to become more intentional at looking at these output per unit of input gains. Great things are happening.
Here are a few extra definitions:
- BTU – One Btu is the quantity of heat required to raise the temperature of one pound of liquid water by 1° Fahrenheit (F)
- Metric Ton (of CO2) – The BTU is an English unit of measure like gallons, acres, Fahrenheit, and tons. A Metric ton is one thousand kilograms (1,000 kg). US agricultural sales are conducted in English tons in the US and when imported or exported, are measured in metric tons. If you are buying and selling in both, you had better know the difference. (US English ton = 2,000 lbs. A Metric ton is 2,200 lbs, or 1,000 kg x 2.2 lbs/kg = 2,200 lbs)
- Chained (2017) GDP Dollars – The 2017 GDP dollars is explained above. But the chained part refers to use of seasonally adjusted prices. There are benefits to knowing price changes without adjusting for the annual cycles, and benefits to looking at impacts of the annual cycles. The latter is referred to as chained.


Comments
The More and Less of US Energy Consumption — No Comments
HTML tags allowed in your comment: <a href="" title=""> <abbr title=""> <acronym title=""> <b> <blockquote cite=""> <cite> <code> <del datetime=""> <em> <i> <q cite=""> <s> <strike> <strong>